Allos 01 · Product design · Data as a Service
Store Insights
Research, design and evolution of the report that turns mall sales data into decisions for store owners.

Summary
Monetizing data from the ALLOS benefits program.
I was the designer in charge of Store Insights end to end. I ran all the research, defined the information architecture and designed the report and Allan's WhatsApp messages.
- Role
- Product Designer
- Team
- Product Manager, Product Owner, Data Engineer and Sales
- Deliverables
- Store Insights Branches (the store), Store Insights Chains (the brand) and Allan on WhatsApp
- Methods
- Sales discovery, CSD matrix, personas, Feedback interviews, research repository and backlog prioritization
Context
ALLOS's challenge was to monetize what the benefits program revealed about the users who upload receipts. ALLOS manages the malls and sees the sales of every store. Through the program, it also sees who buys: customers register their receipt in the app in exchange for benefits, and the receipt reaches the data lake the next day. From the app onboarding, ALLOS also has demographic and personal data on this audience.
- 2.2Mactive app users (Dec 2025)
- 37malls with a loyalty program
- R$ 5.6Bin sales recognized by the program in 2025, 15.7% of ALLOS sales
The Data as a Service team, within Monetization, bet that store owners would pay to know three things: where they lose sales, who their audience is and how they compare with competitors in the same mall.
Problem
The first version was a monthly PDF report, built from the data ALLOS had, and store owners couldn't get a decision out of it.
Who am I being compared with?
I want to tell Allan myself how I want the data.
With no clear period, no way of knowing whose number each one was and no fair comparison, the data seemed unreliable. Store owners were afraid of misreading it and abandoned parts of the report. In sales, the problem repeated itself: the pitch got lost on WhatsApp, the ALLOS number was unknown and the free trial format made people afraid of being signed up for a mandatory subscription.
Research
- 01
Sales discovery
Listening to sales calls and meetings between July and August 2025, a certainties, assumptions and doubts matrix, and two store owner profiles: those who know data and those who don't.
- 02
Feedback
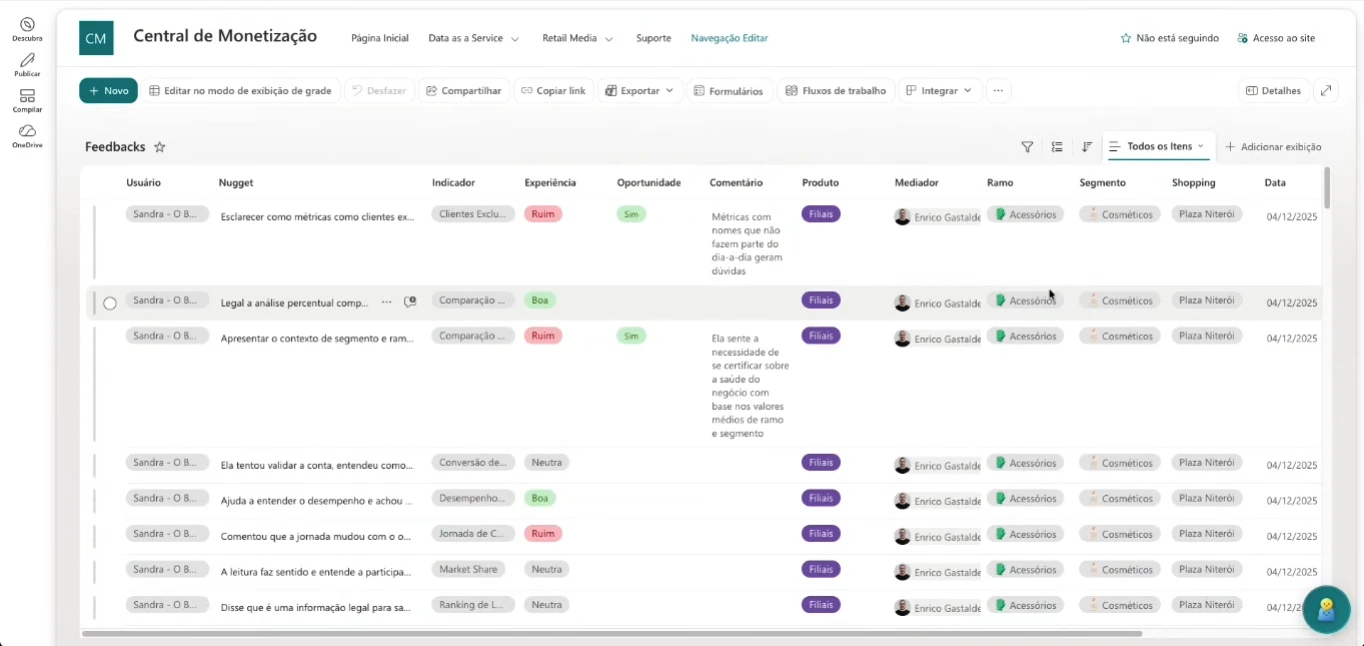
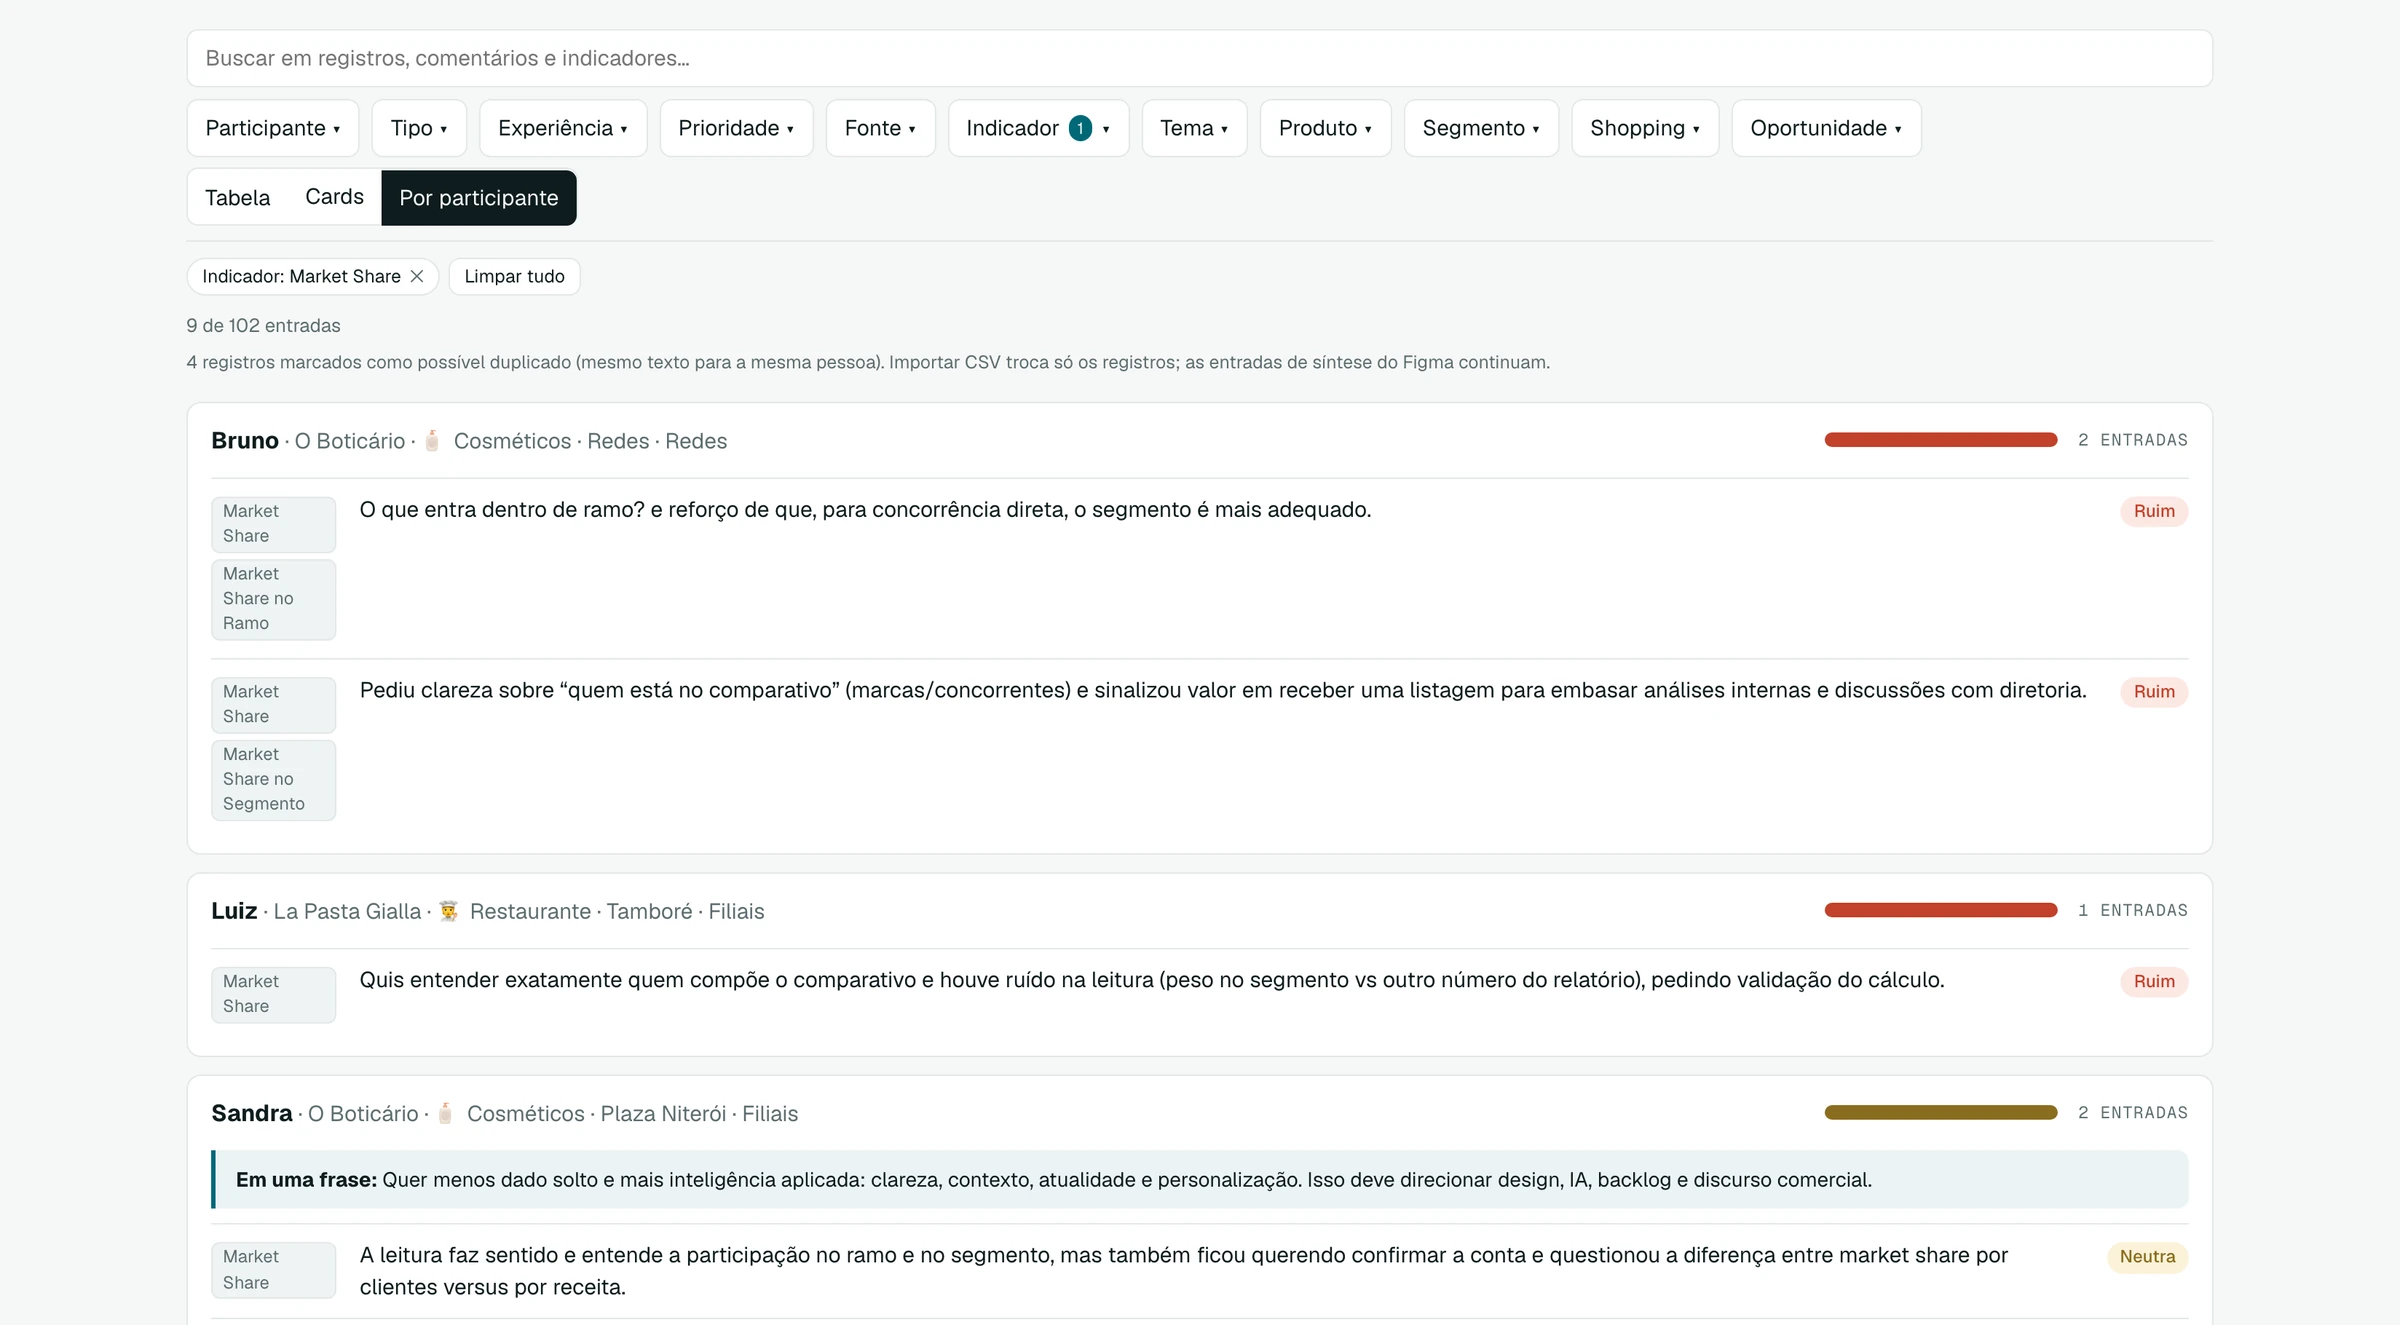
Seven interviews with subscribing store owners in cosmetics, food, restaurants and leisure, reading their own report with me.
- 03
Research repository
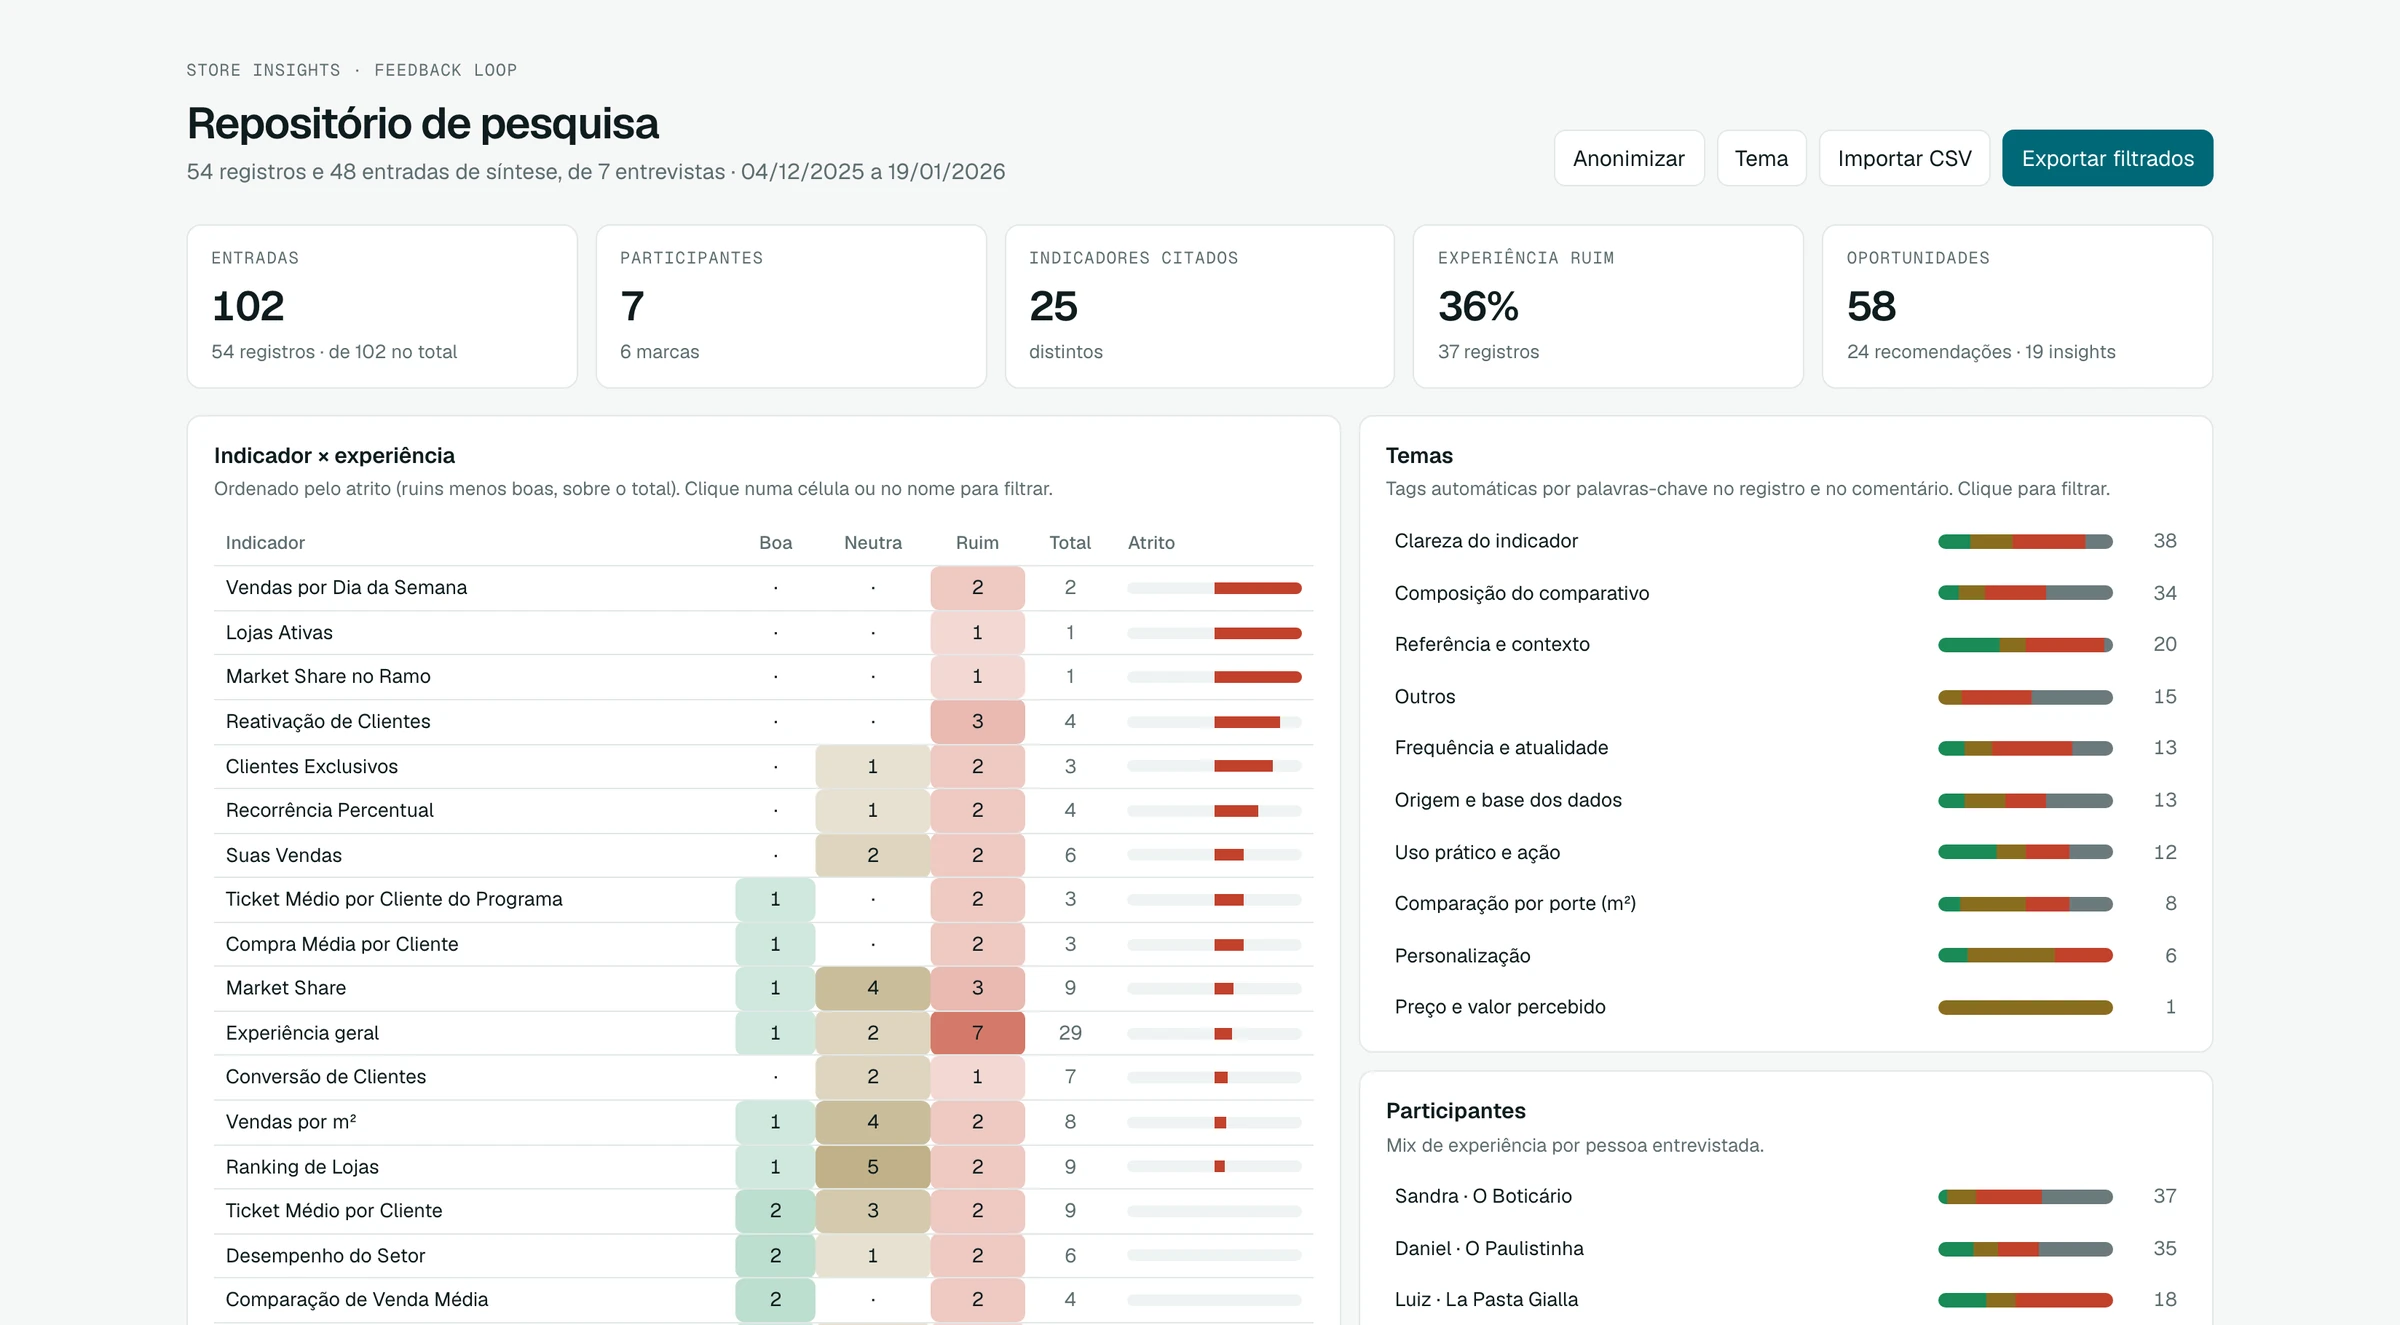
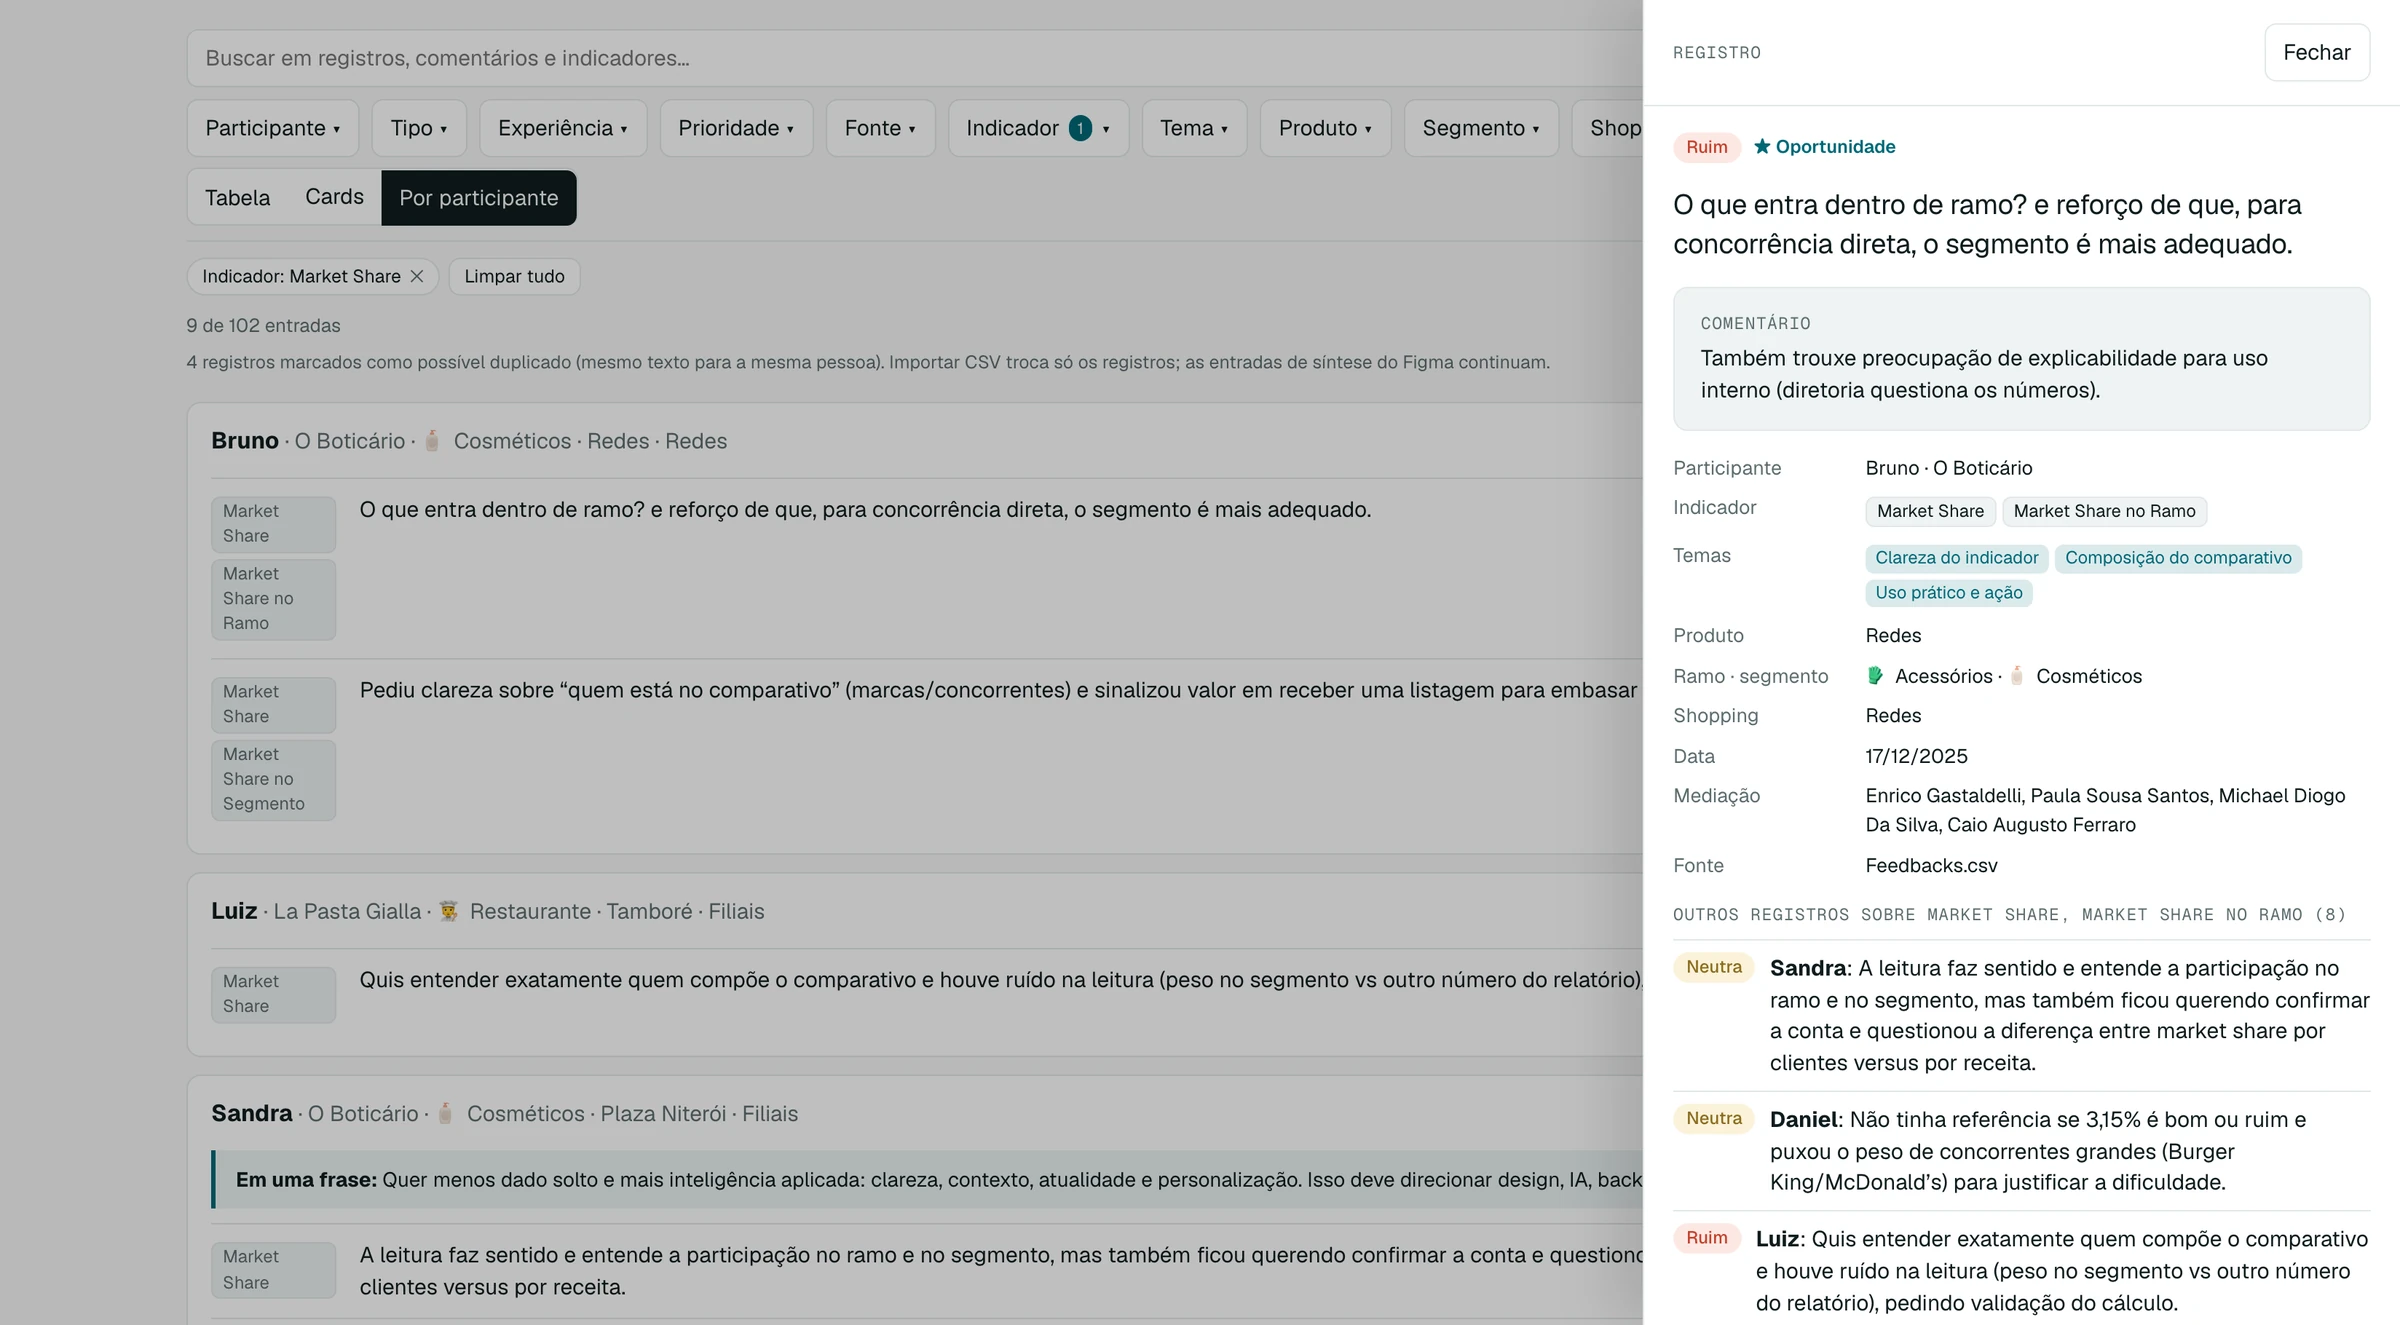
Every reaction became a research record, classified by indicator, experience, theme and opportunity.
- 04
Synthesis
Insights and recommendations per interview, split into product and UX, technology and AI, and sales, already prioritized.
Operational map
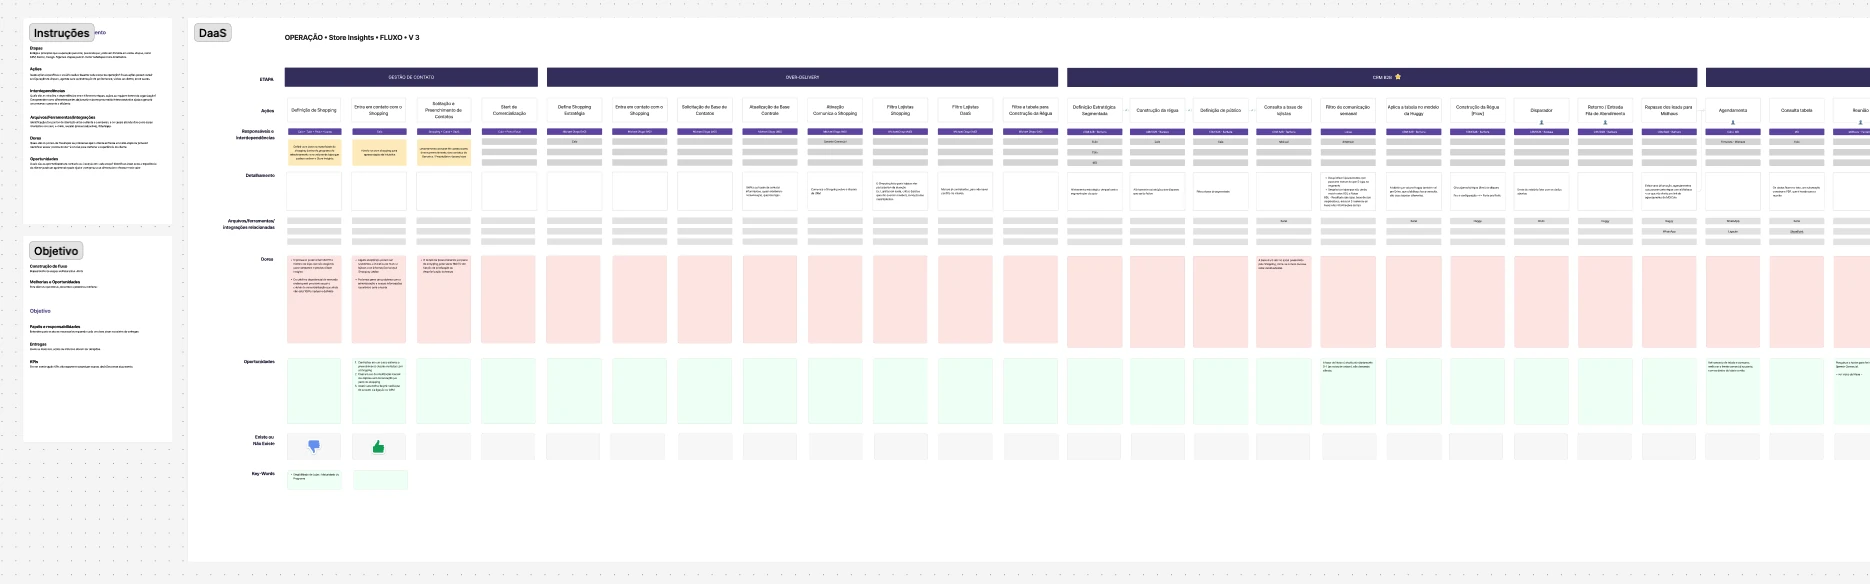
The operational map covered contact management, over-delivery, B2B CRM, negotiation, closing and billing, product, flow, feedback and research.
Personas
Store Insights has three personas. In Chains, the franchise manager, who follows the brand across the country, regions and markets. In Branches, the owner, who looks at the big picture of the business, and the store manager, who is on the front line of operations.
Chains · Franchise manager
- Context and routine
- Works in a multi-unit context, making decisions for more than one store and/or market. Reviews performance periodically and "locks in" growth priorities, asking for action plans and refining the routine analysis.
- Motivations and emotions
- Driven by clarity to decide "where to bet" and "where to correct course" without wasting time on data that isn't comparable. Gets anxious when the data seems "mixed" (unfaithful comparisons) and when there are no clear levers to raise loyalty/recurrence and results per store.
- Goals
Prioritize growth opportunities (market share and productivity, such as sales/m²) and set focus by market/segment.
Understand the makeup and quality of the customer base (e.g. segmentation by "stars" or program, below-average recurrence) to design a loyalty strategy.
Validate the impact of programs and benefits (promotions, mall subsidies, etc.) and decide where to expand/adjust the initiative.
- Pain points
Needs clear context to justify actions internally (leadership questions the numbers).
Visibility into where to correct course or act on share lost to competitors.
Lack of a full view when building strategies that scale.
- Behavior with the report
Uses the report as a governance input: compares month over month and against the "market/competitors", looks for rankings/benchmarks and asks questions to adjust the reading.
Connects insights to initiatives (benefit programs, loyalty) and already thinks about "how to scale" activation, including incentives for operations and growing the registered/identified base.
Branches · Owner
- Context and routine
- Looks at the big picture of their own business. Usually reviews numbers with someone else (e.g. on a computer, in a meeting room) and needs to "read" the report calmly to interpret it correctly.
- Motivations and emotions
- Gets anxious when they don't understand exactly what they're comparing (line of business vs. segment; who the direct competitors are).
- Goals
Quickly understand whether a drop/rise is "mine" or the market's (comparisons and YoY base) to decide on corrective action.
Validate the impact of programs and benefits (promotions, mall subsidies, etc.) and decide where to expand/adjust the initiative.
- Pain points
- Visibility into where to correct course or act on lost share.
- Behavior with the report
- Asks clarifying questions, looking for confirmation so as not to misread before taking action in the store.
Branches · Store manager
- Context and routine
- On the front line: runs the store day to day, under pressure for immediate results and operational decisions (staffing, approach, promotions).
- Motivations and emotions
- Driven by "what do I do now" to sell more without shooting in the dark. Gets anxious when the data isn't recent (wants a weekly/biweekly view).
- Goals
- Monitor actionable indicators (ticket, sales, market share in the segment) to guide promotions, staffing and sales execution.
- Pain points
- Execution blocked by operational constraints (labor, seasonality, staffing) and difficulty putting ideas into practice even when they already know "what they should do".
- Behavior with the report
- Uses the report as a diagnostic "check" and then turns it into practical actions.
What I learned
- Trust in the data
- Store owners kept coming back to the same number trying to understand the period, the base and the calculation.
- The comparison has to be fair
- A restaurant doesn't want to be compared with the food court, nor a store with a kiosk.
- Monthly isn't enough
- Store owners make decisions every day, so data needs to arrive quickly and often, with monthly, biweekly, weekly and daily views. Each frequency calls for its own reading, customizable by context.
- A number on its own is misleading
- A lower average ticket can be good with high volume. Seeing purchases alongside the ticket helps explain the number, and charts need to be grouped for a more accurate reading.
- The report is a management tool
- It was forwarded to the franchisor and leadership to justify results and ask for support. It had to be ready to pass on.
From finding to solution
Each pain point became a design decision:
- "When is this number from?"
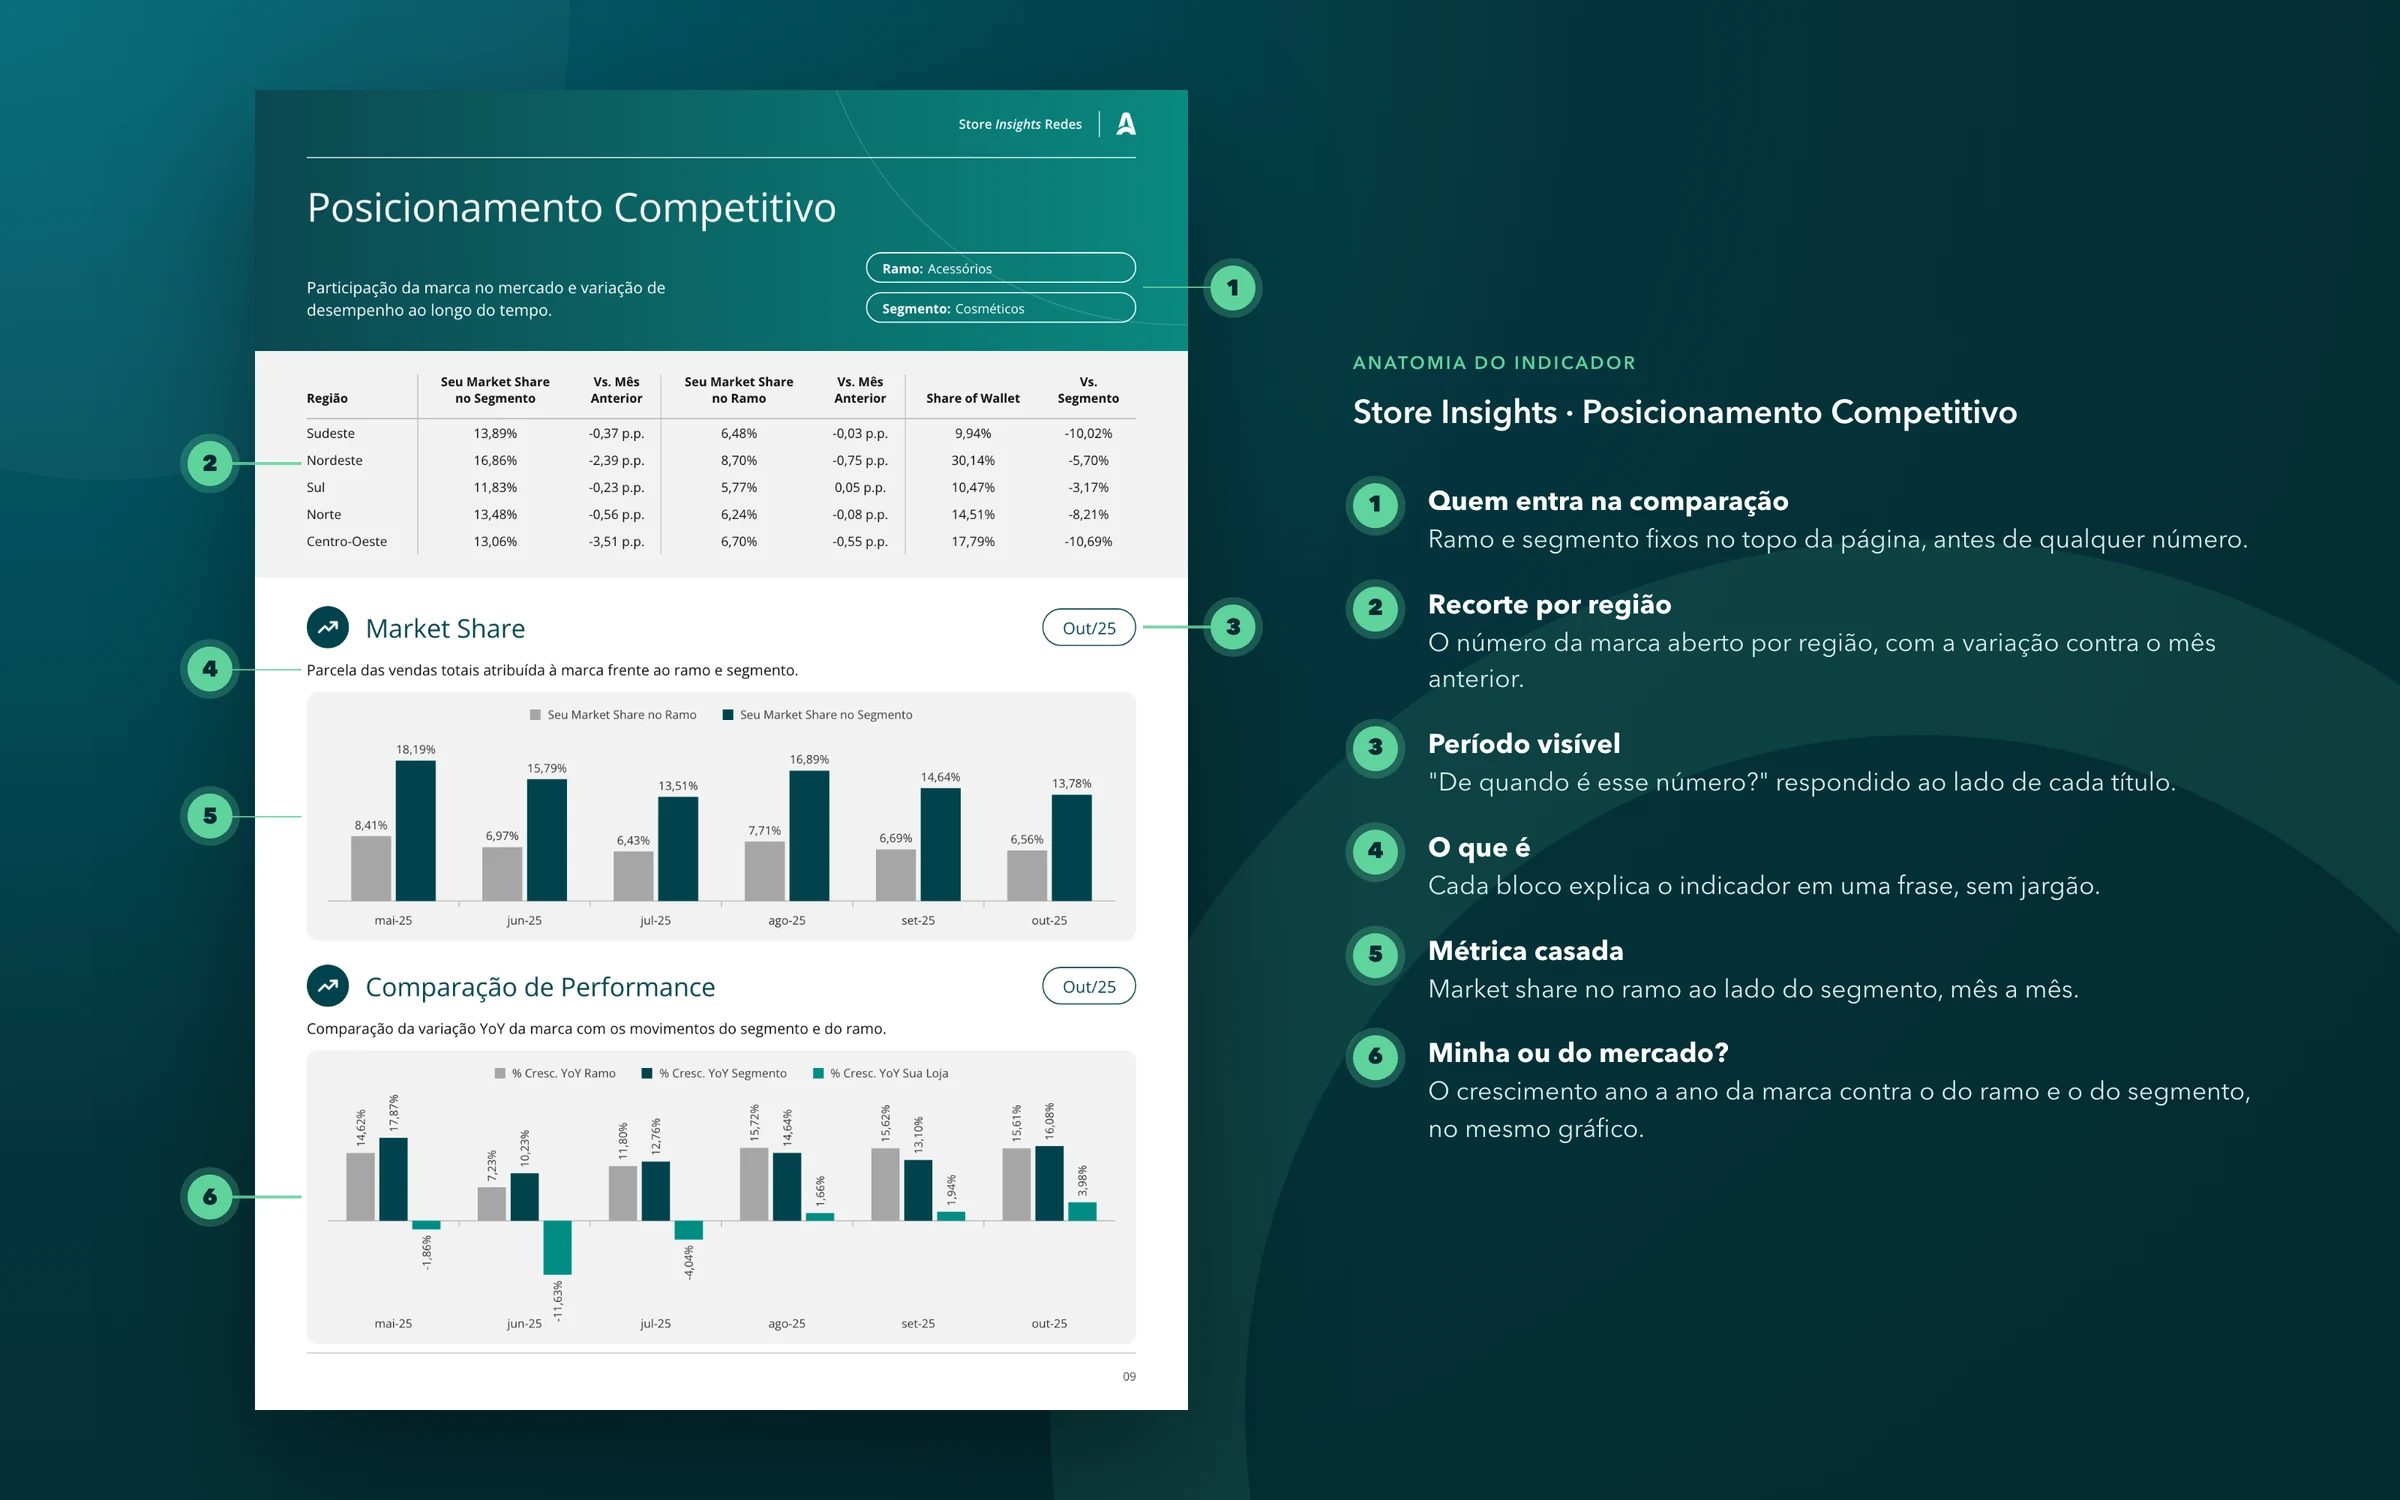
- Period visible at the top of each chart and indicator.
- "Is this number just for my store?"
- A label saying whose number it is (store, line of business or segment) inside the chart itself.
- "Who am I being compared with?"
- Line of business and segment fixed at the top of each page. Comparison with other brands only when there are at least five in the segment (LGPD, Brazil's data protection law).
- "Where does this data come from?"
- Source written in Allan's message itself: "Source: Benefits Program".
- "My ticket is lower. Is that bad?"
- Paired metrics: ticket with number of purchases, market share with sales.
- "Monthly isn't enough."
- Weekly summary on WhatsApp. Daily data went into the roadmap.
- "I want to ask my own way."
- Open questions in Allan 2.0, on the roadmap.
- "I'm going to send this to the franchisor."
- An Overview at the start of the report, with the main indicators on one page.
Indicator anatomy
A standard for building and displaying indicators.
Report
Two versions: Branches, for the store owner and manager, and Chains, for the brand manager.
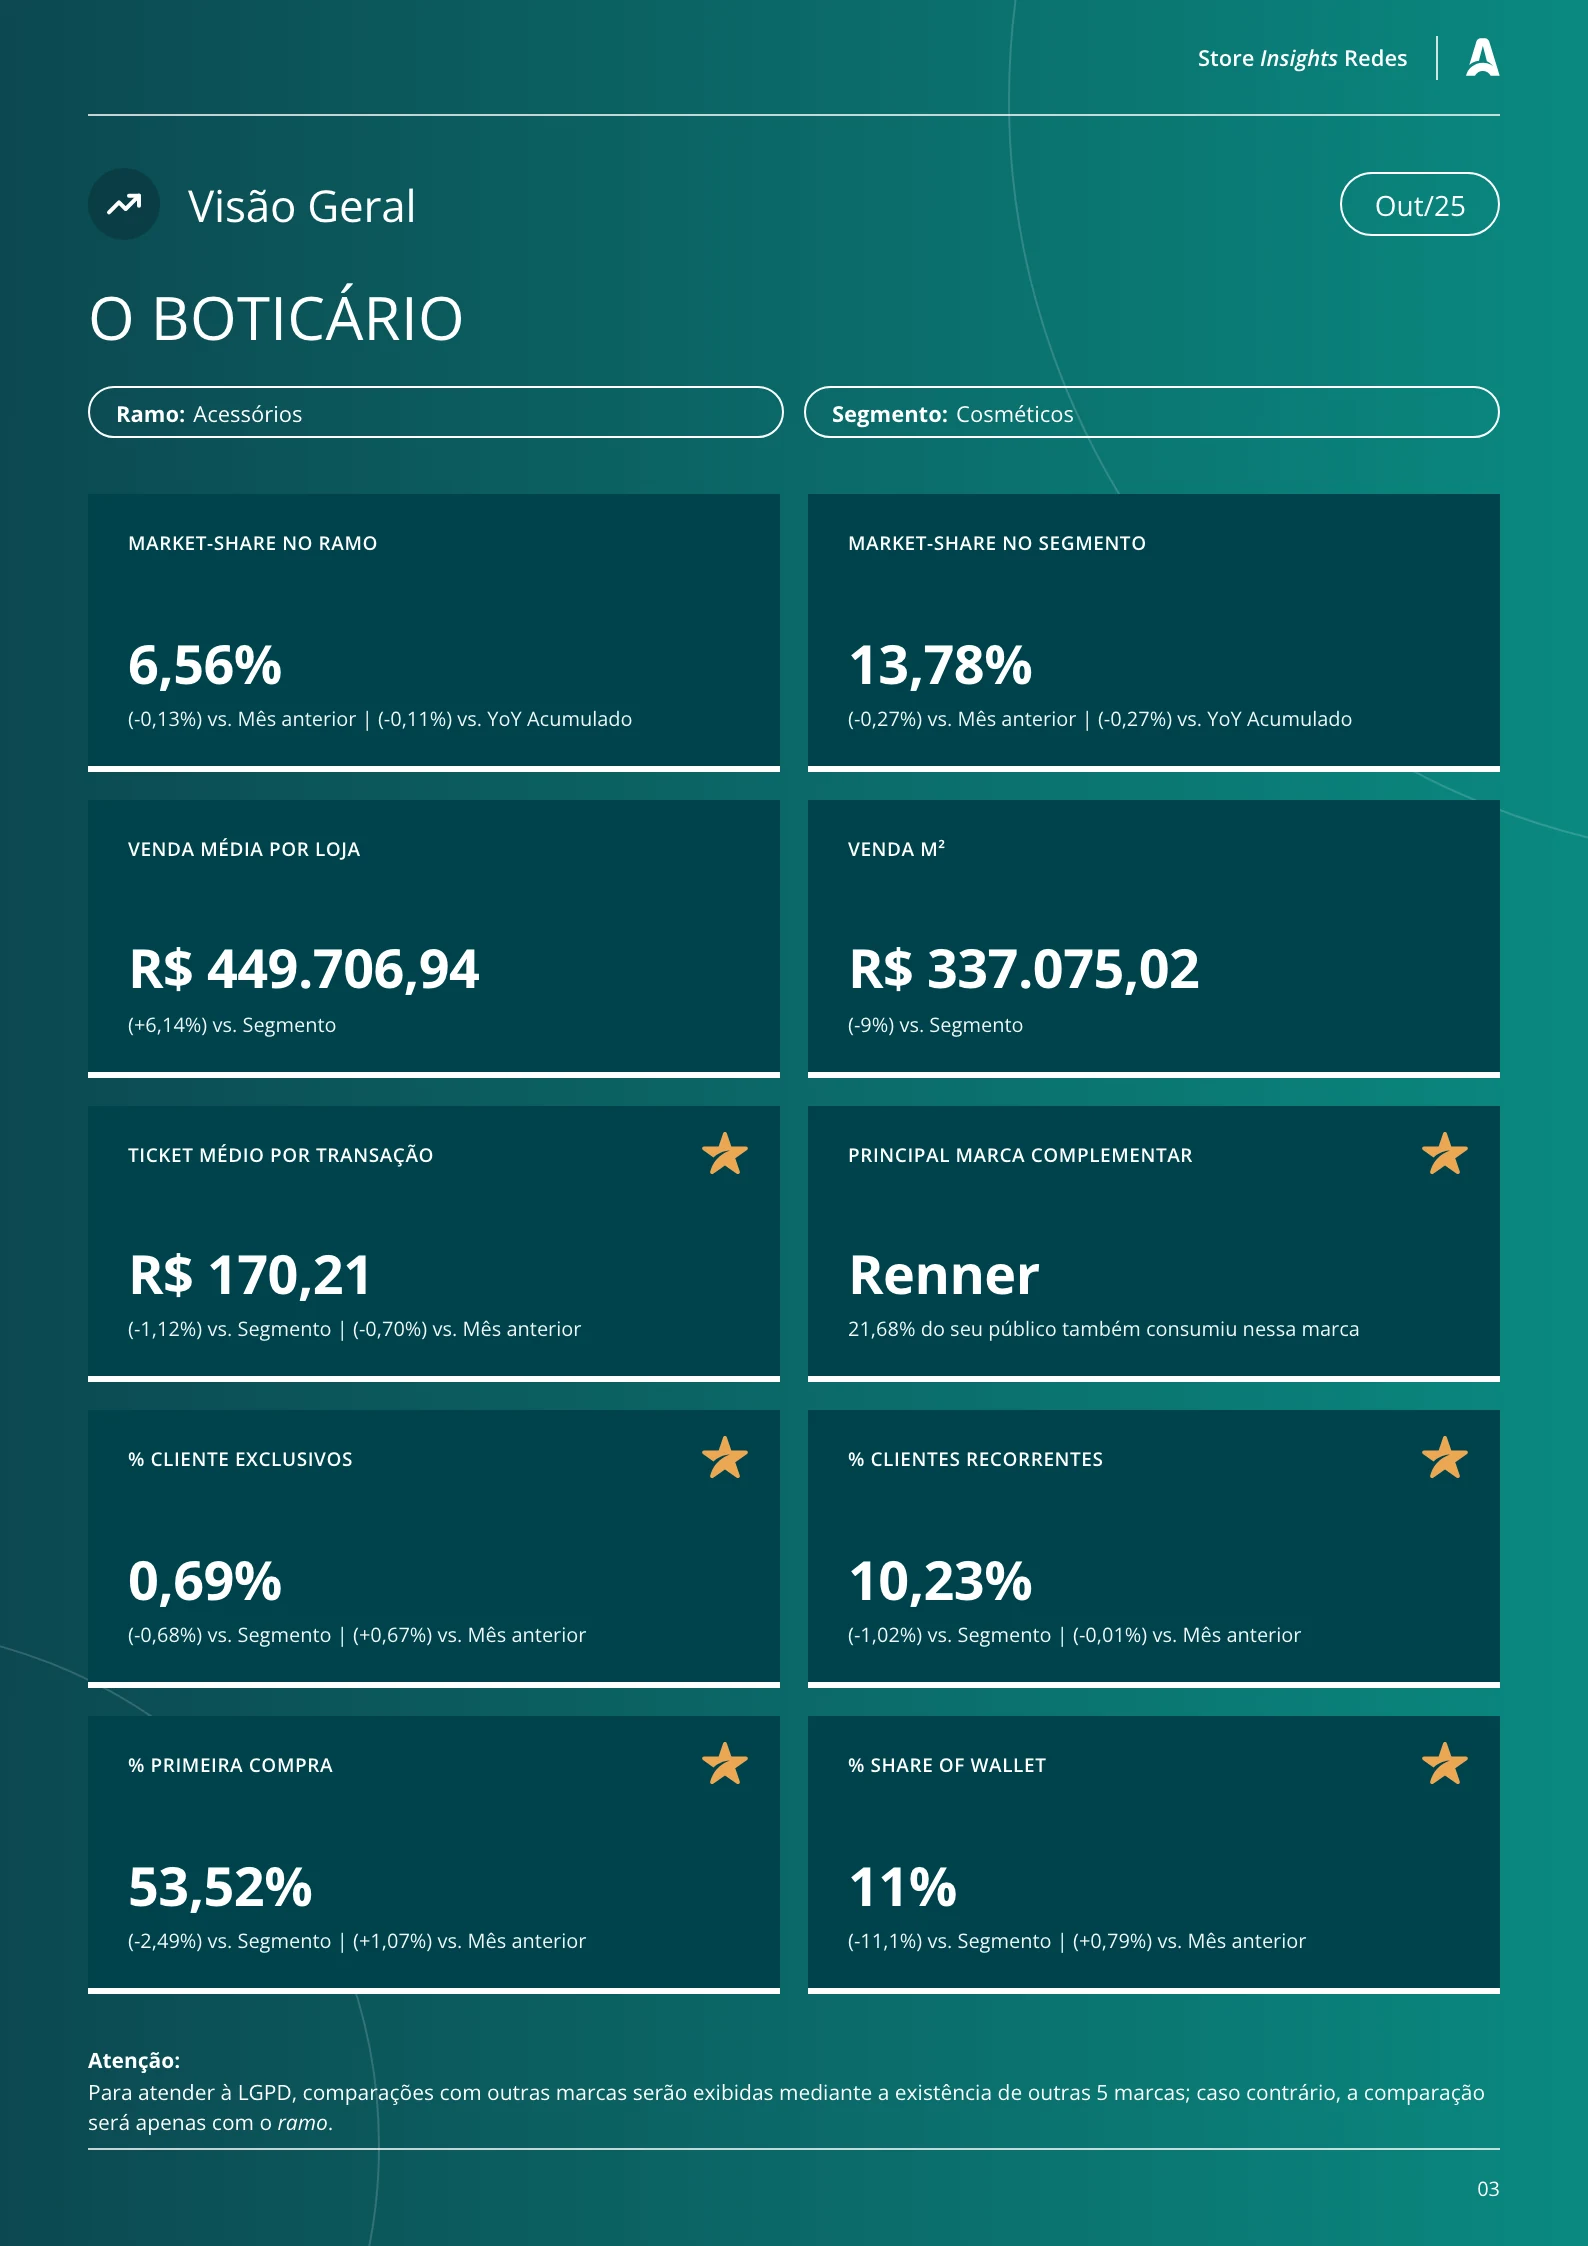
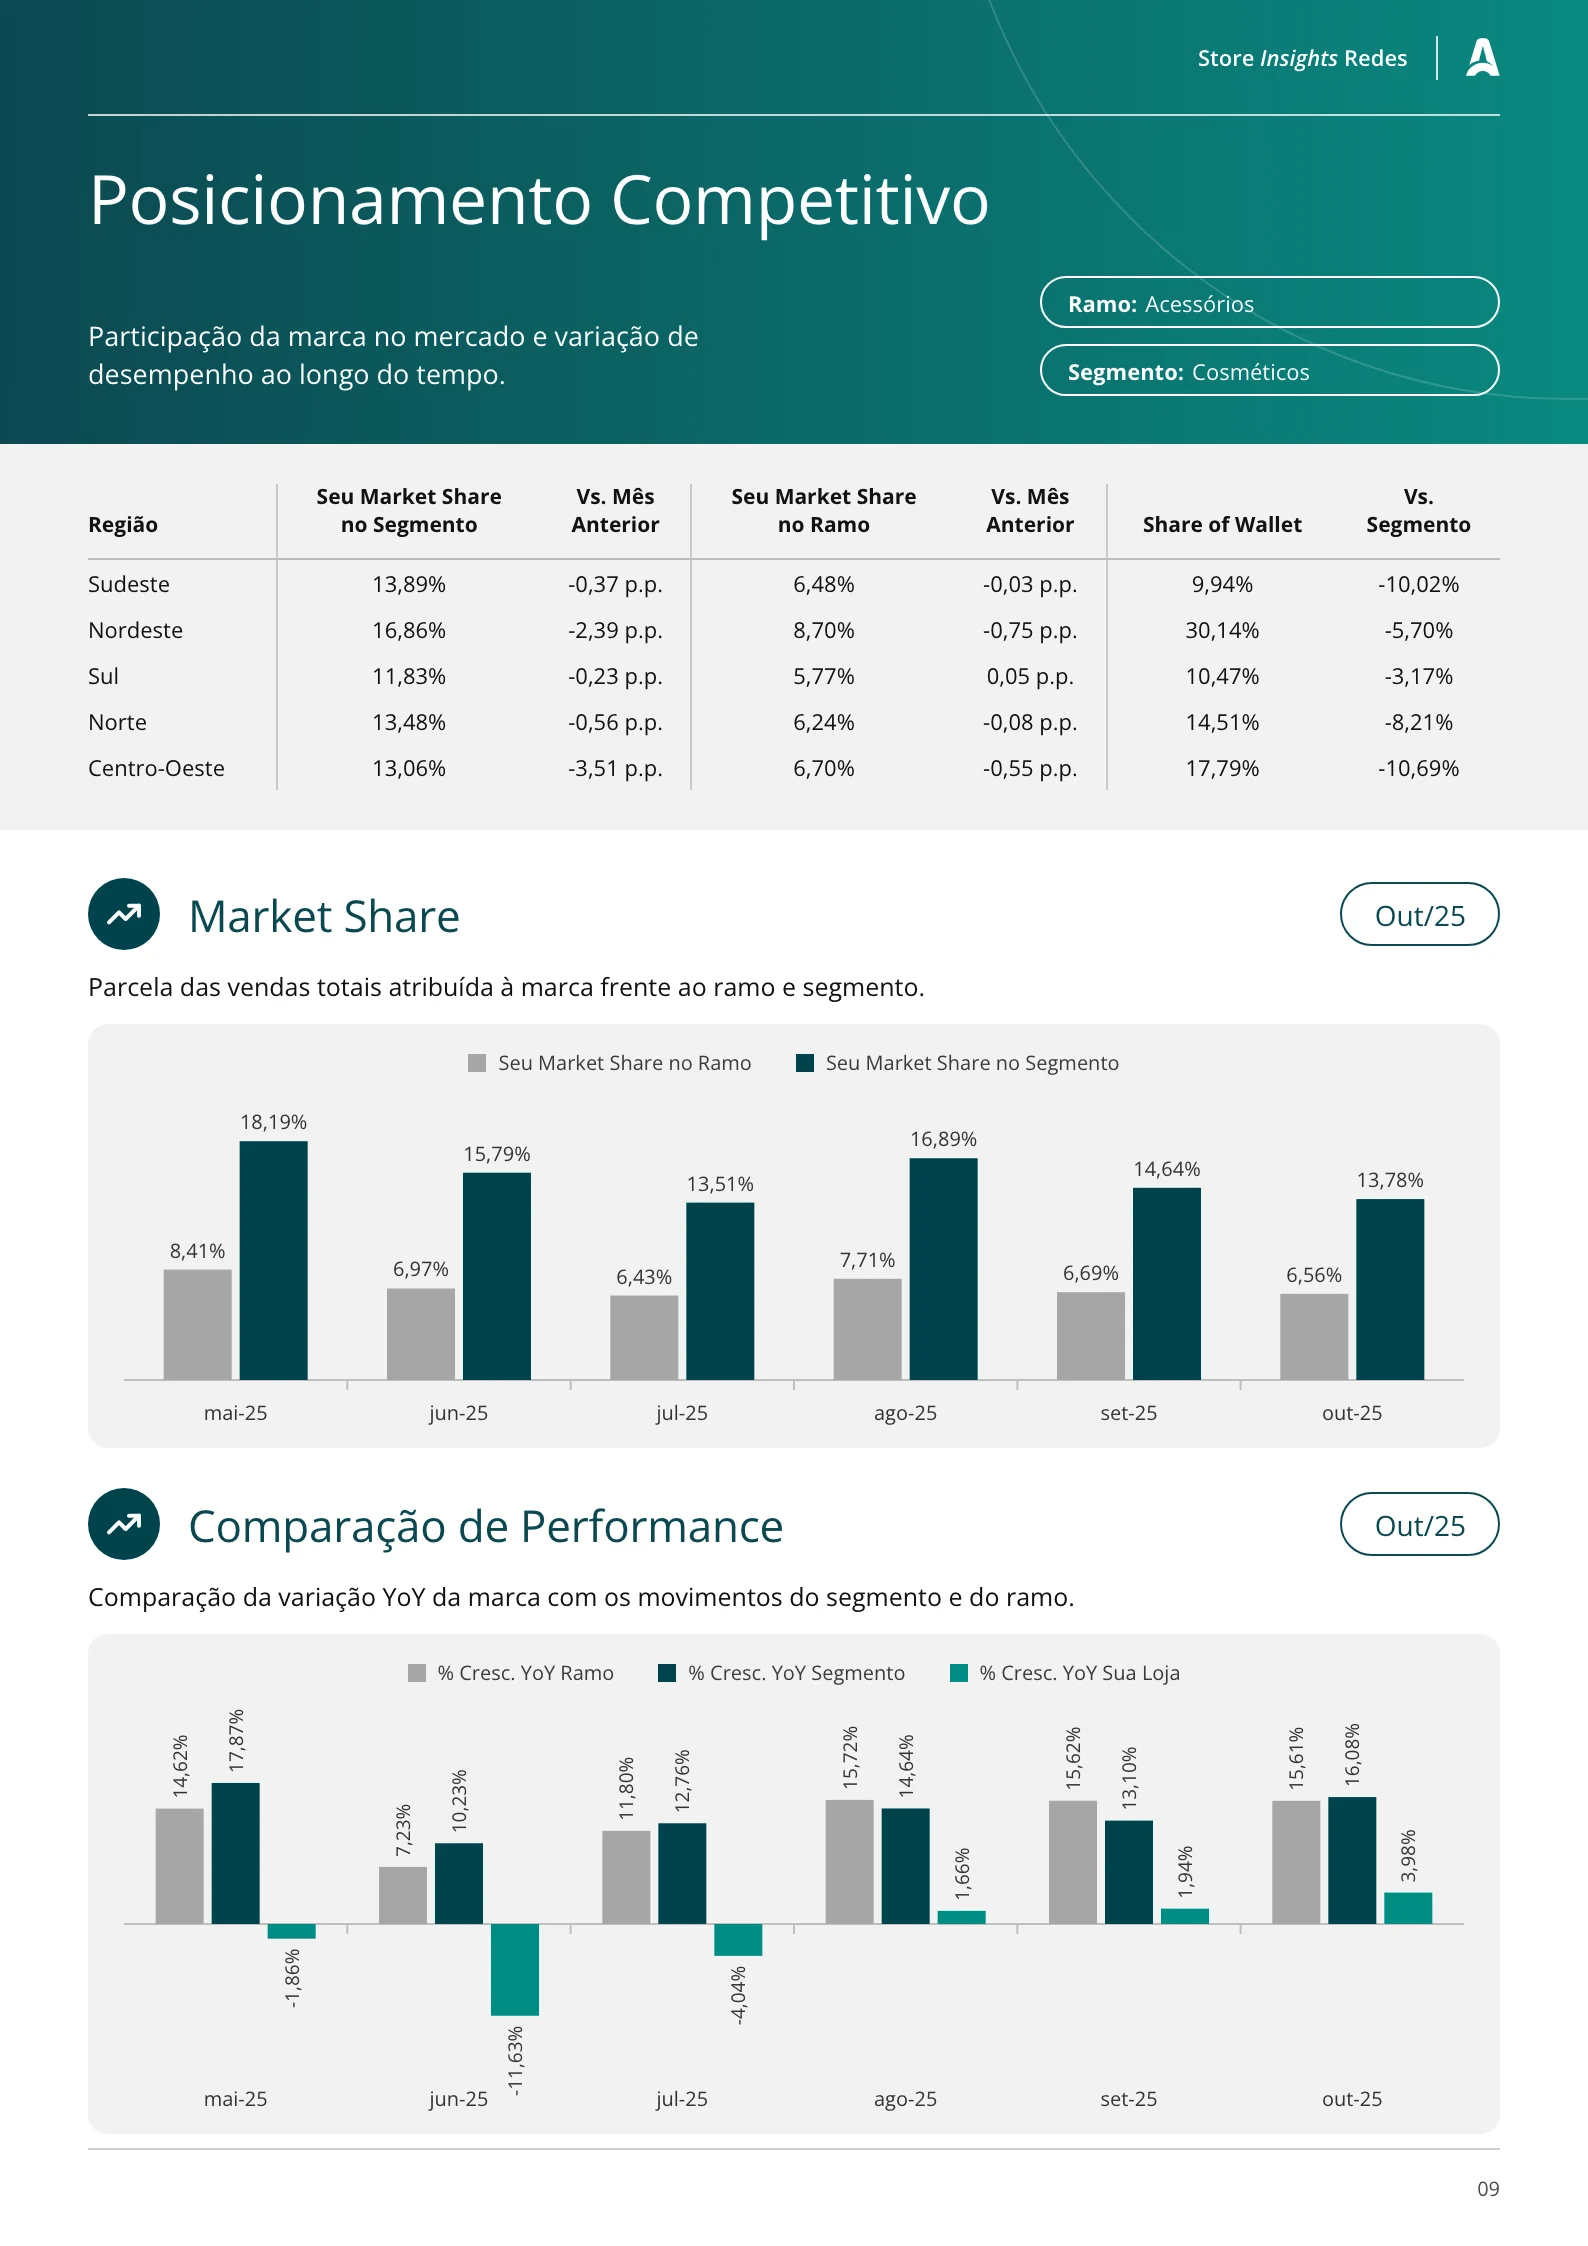
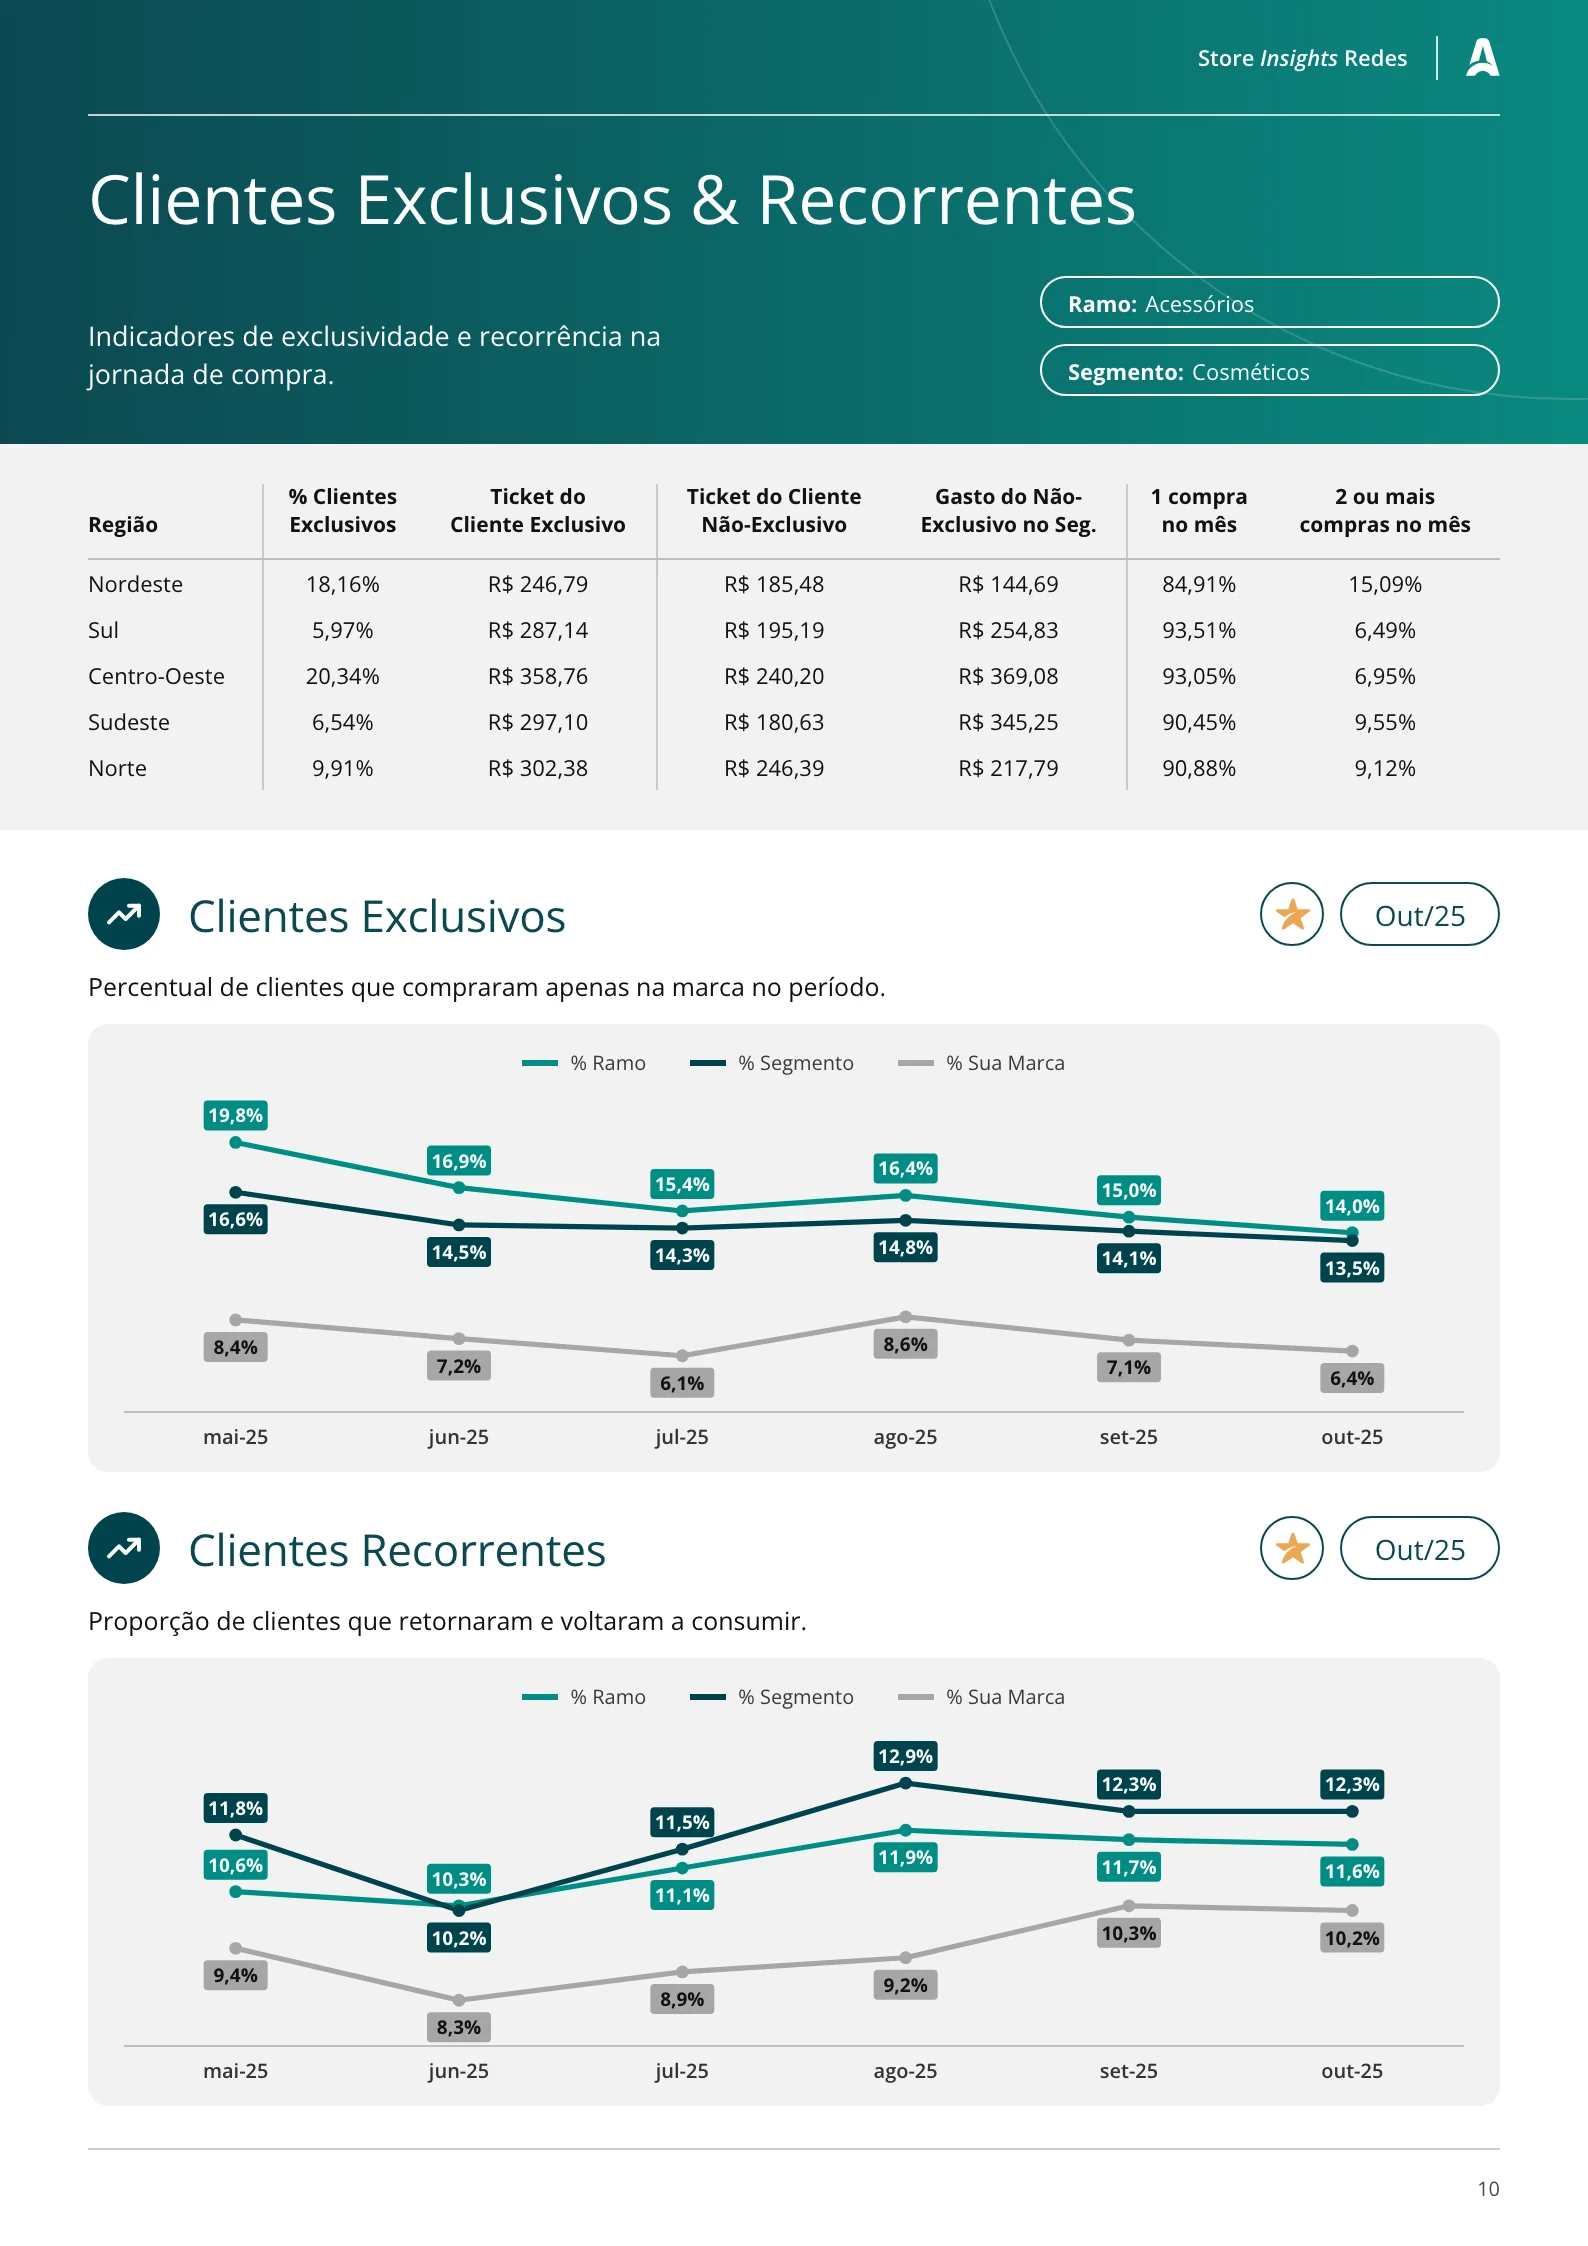
Store Insights Chains, O Boticário, October 2025: overview, competitive positioning, and exclusive and recurring customers.
Allan on WhatsApp
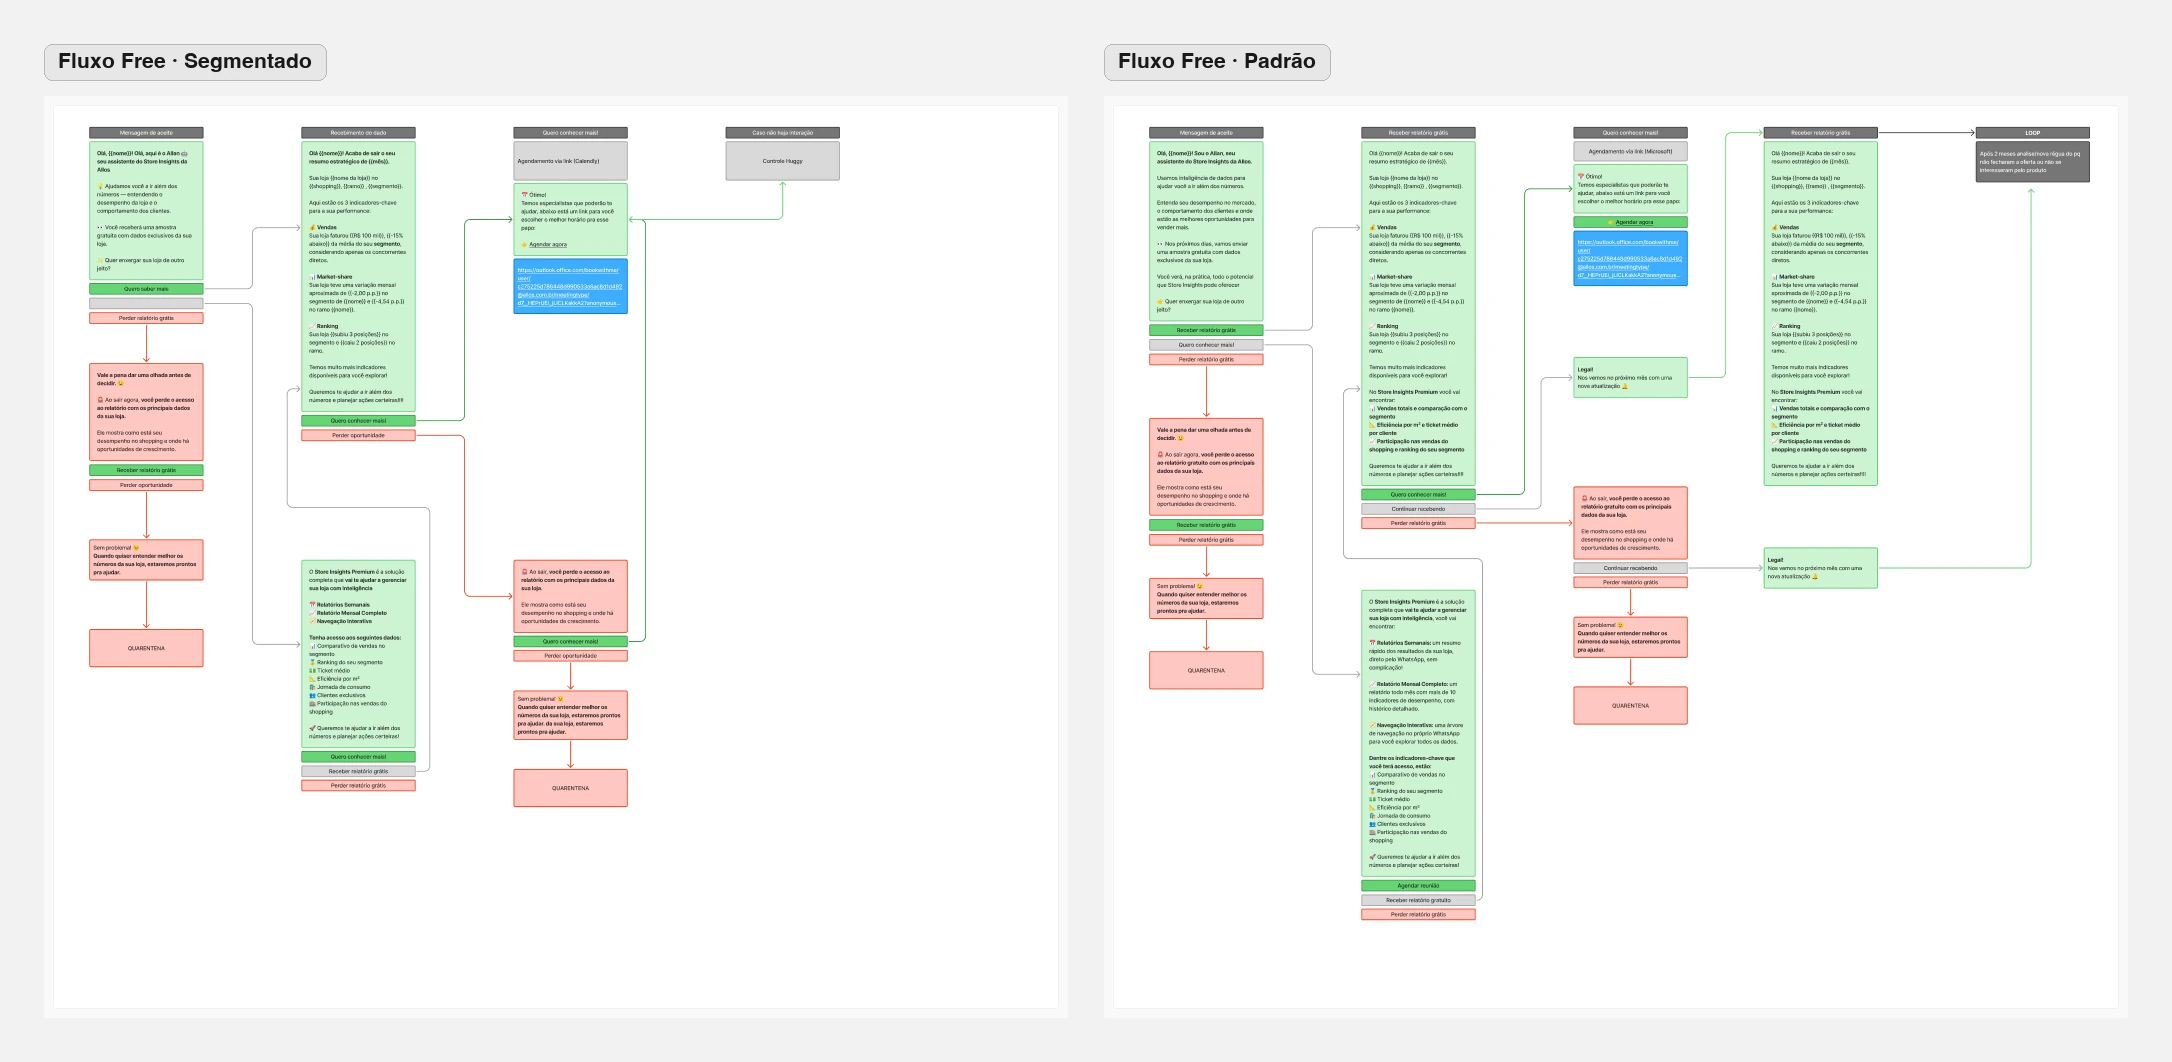
Allan delivers Store Insights on WhatsApp: an introduction with a free sample, a weekly summary, trends with suggested actions, an invitation to Premium and a satisfaction survey. The buttons in each message follow the navigation tree.
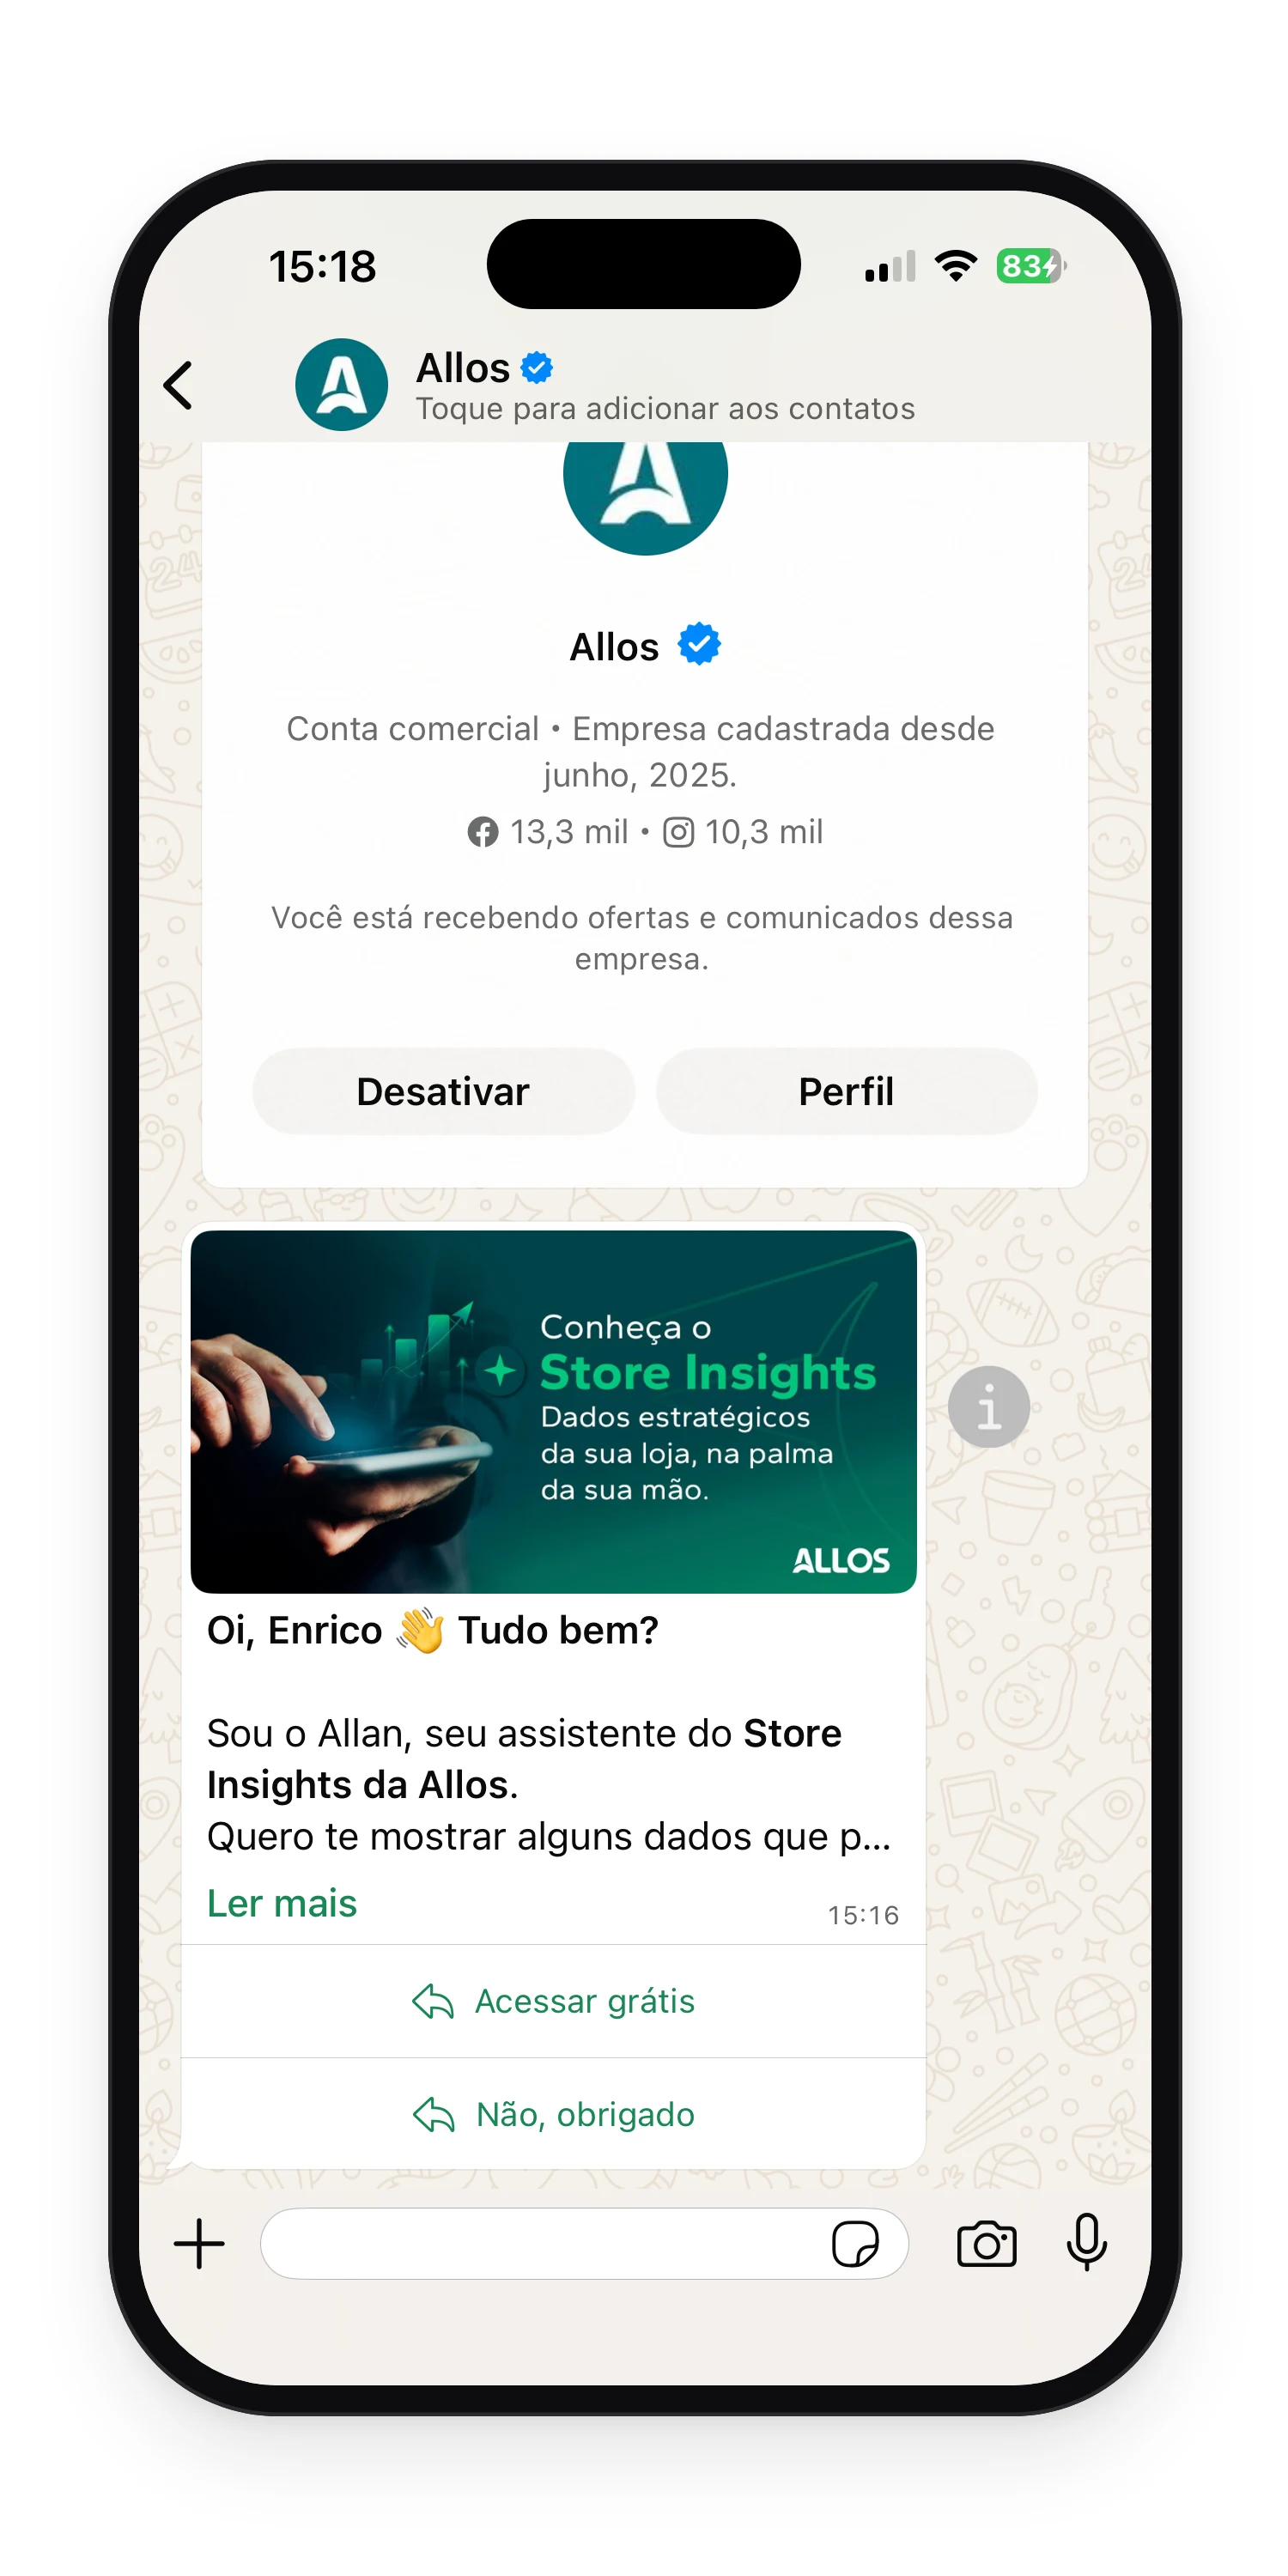
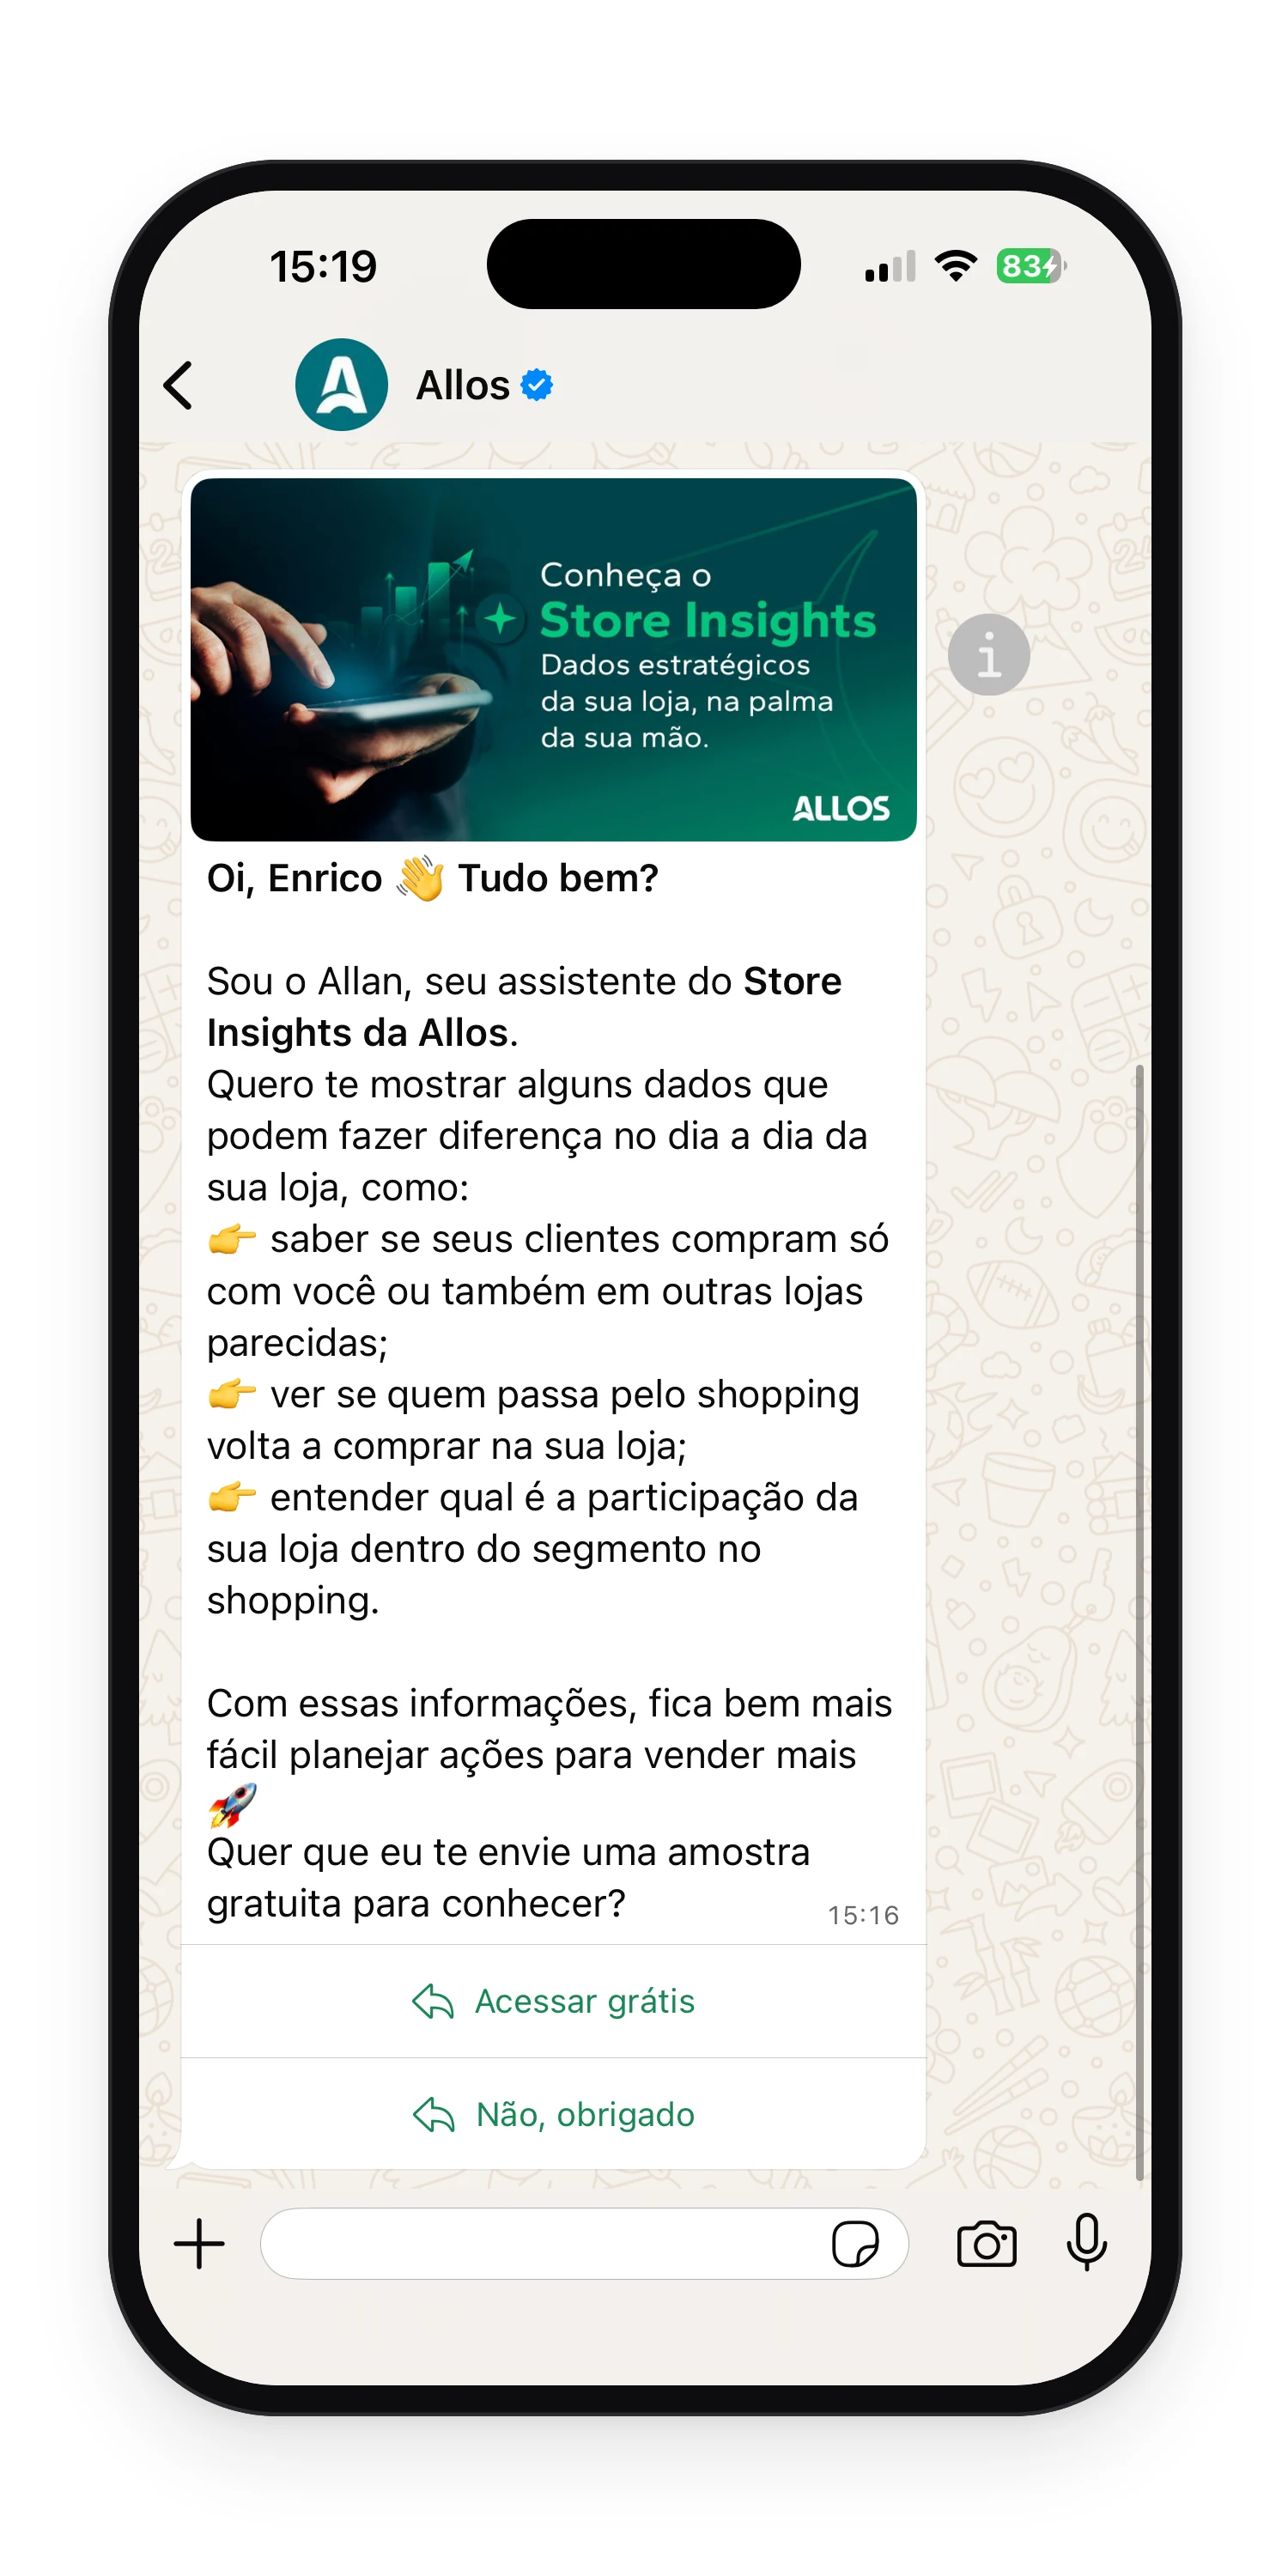
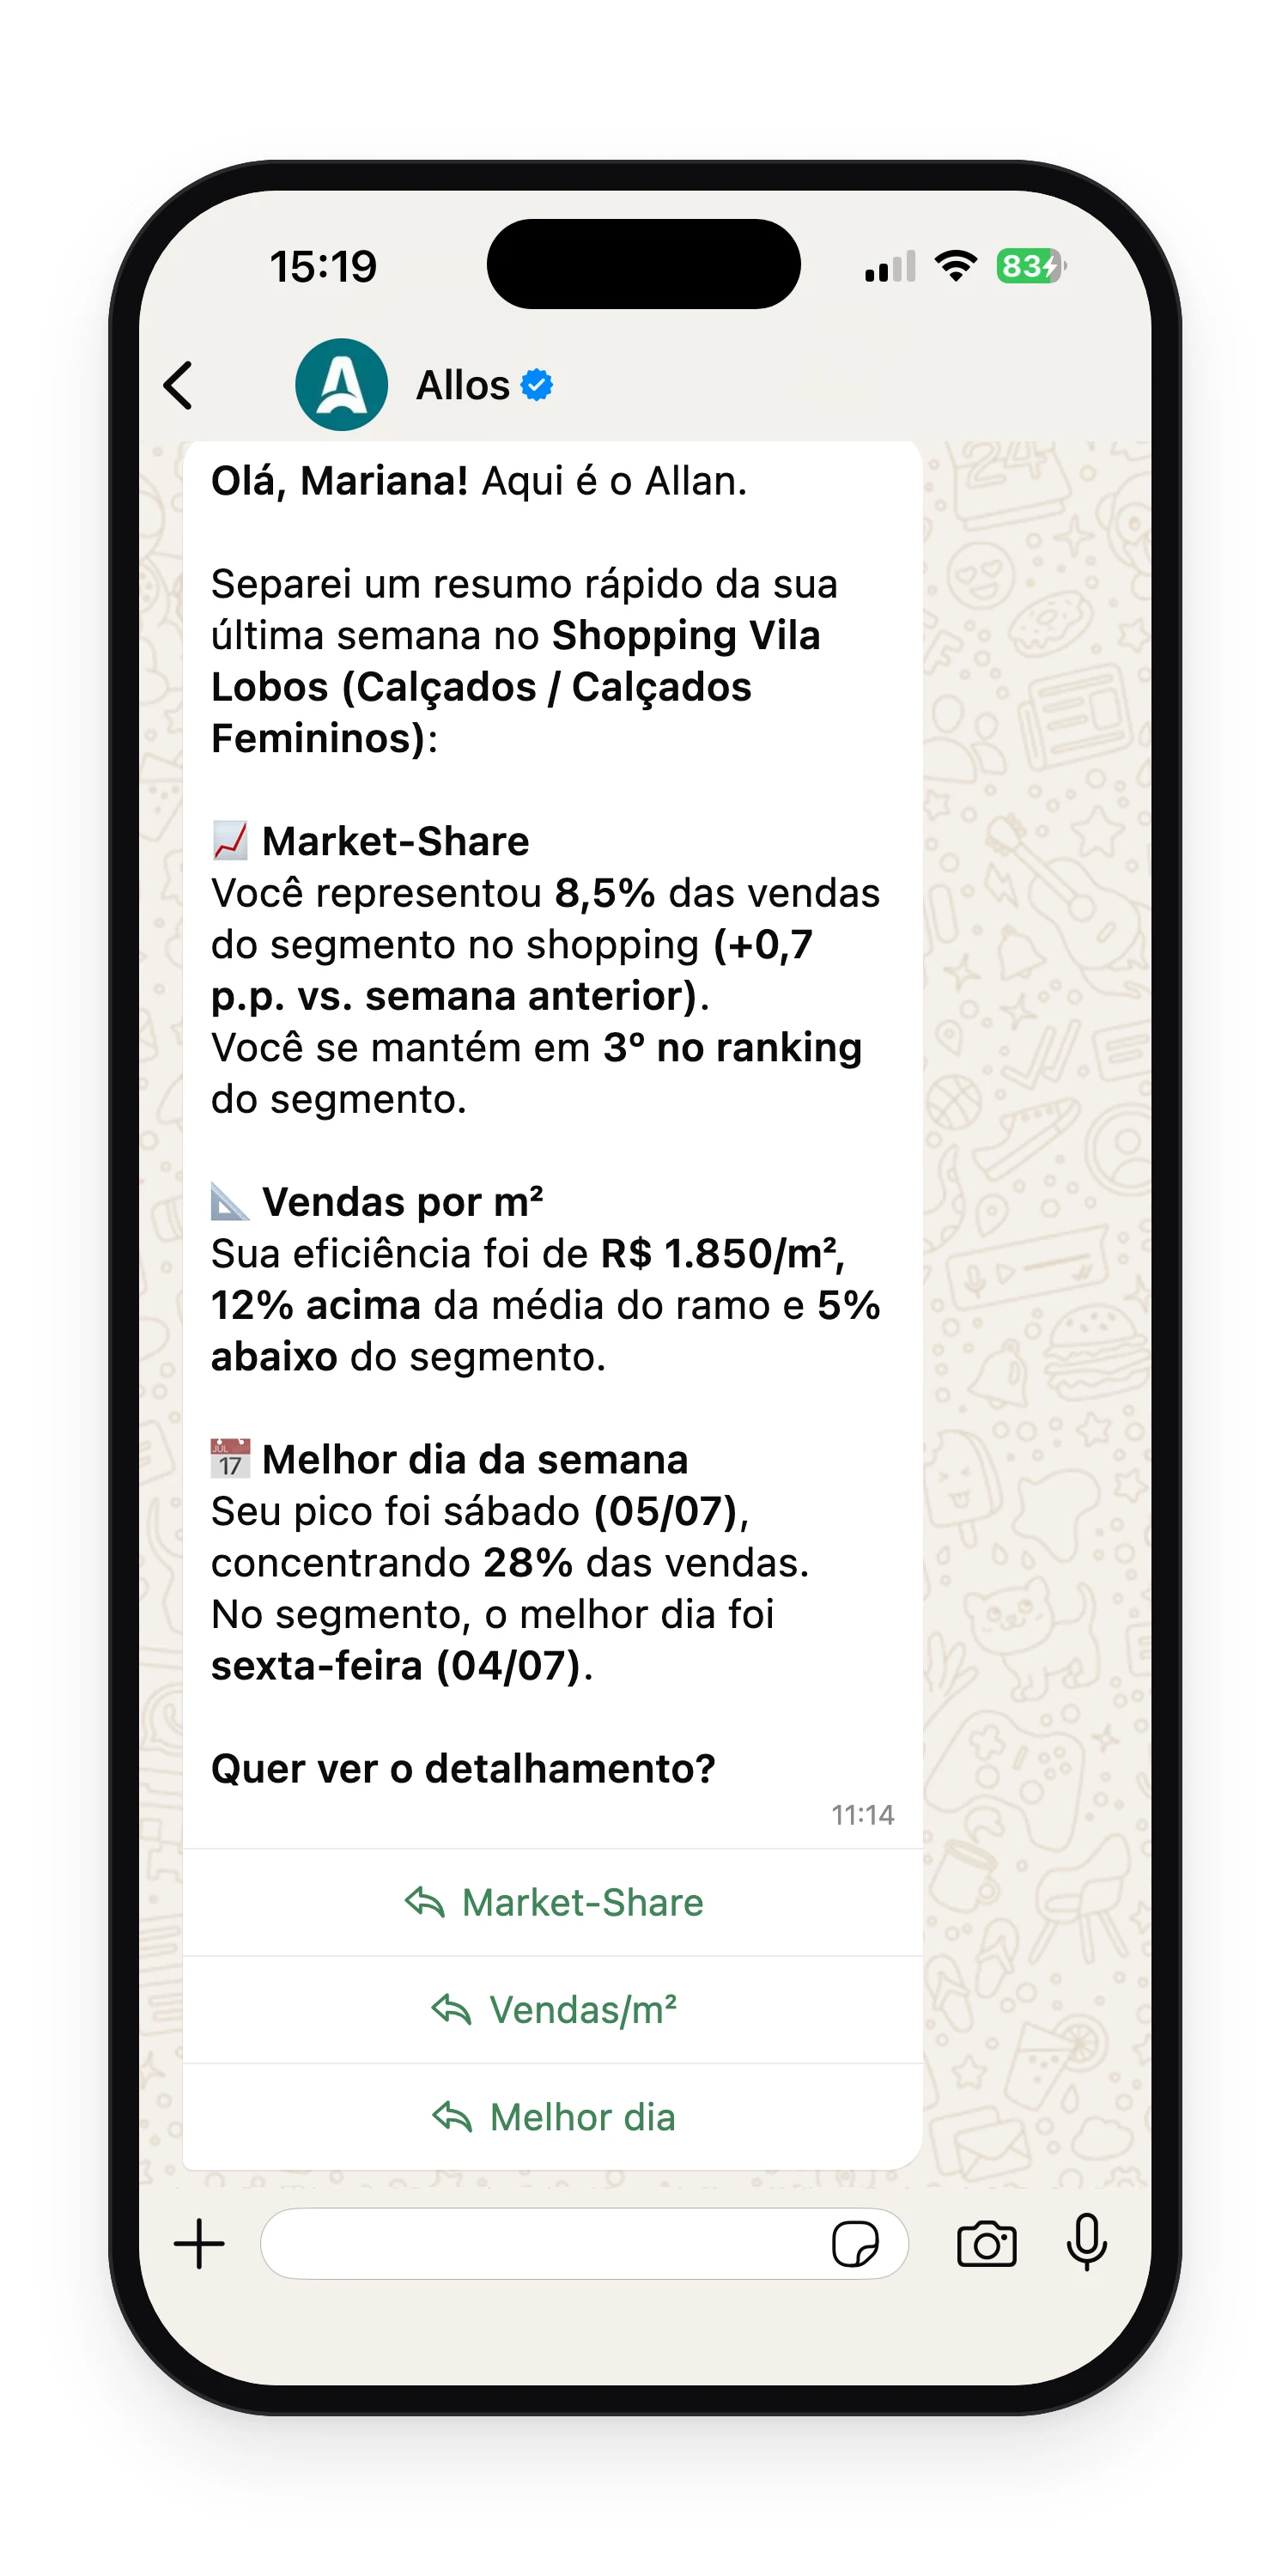
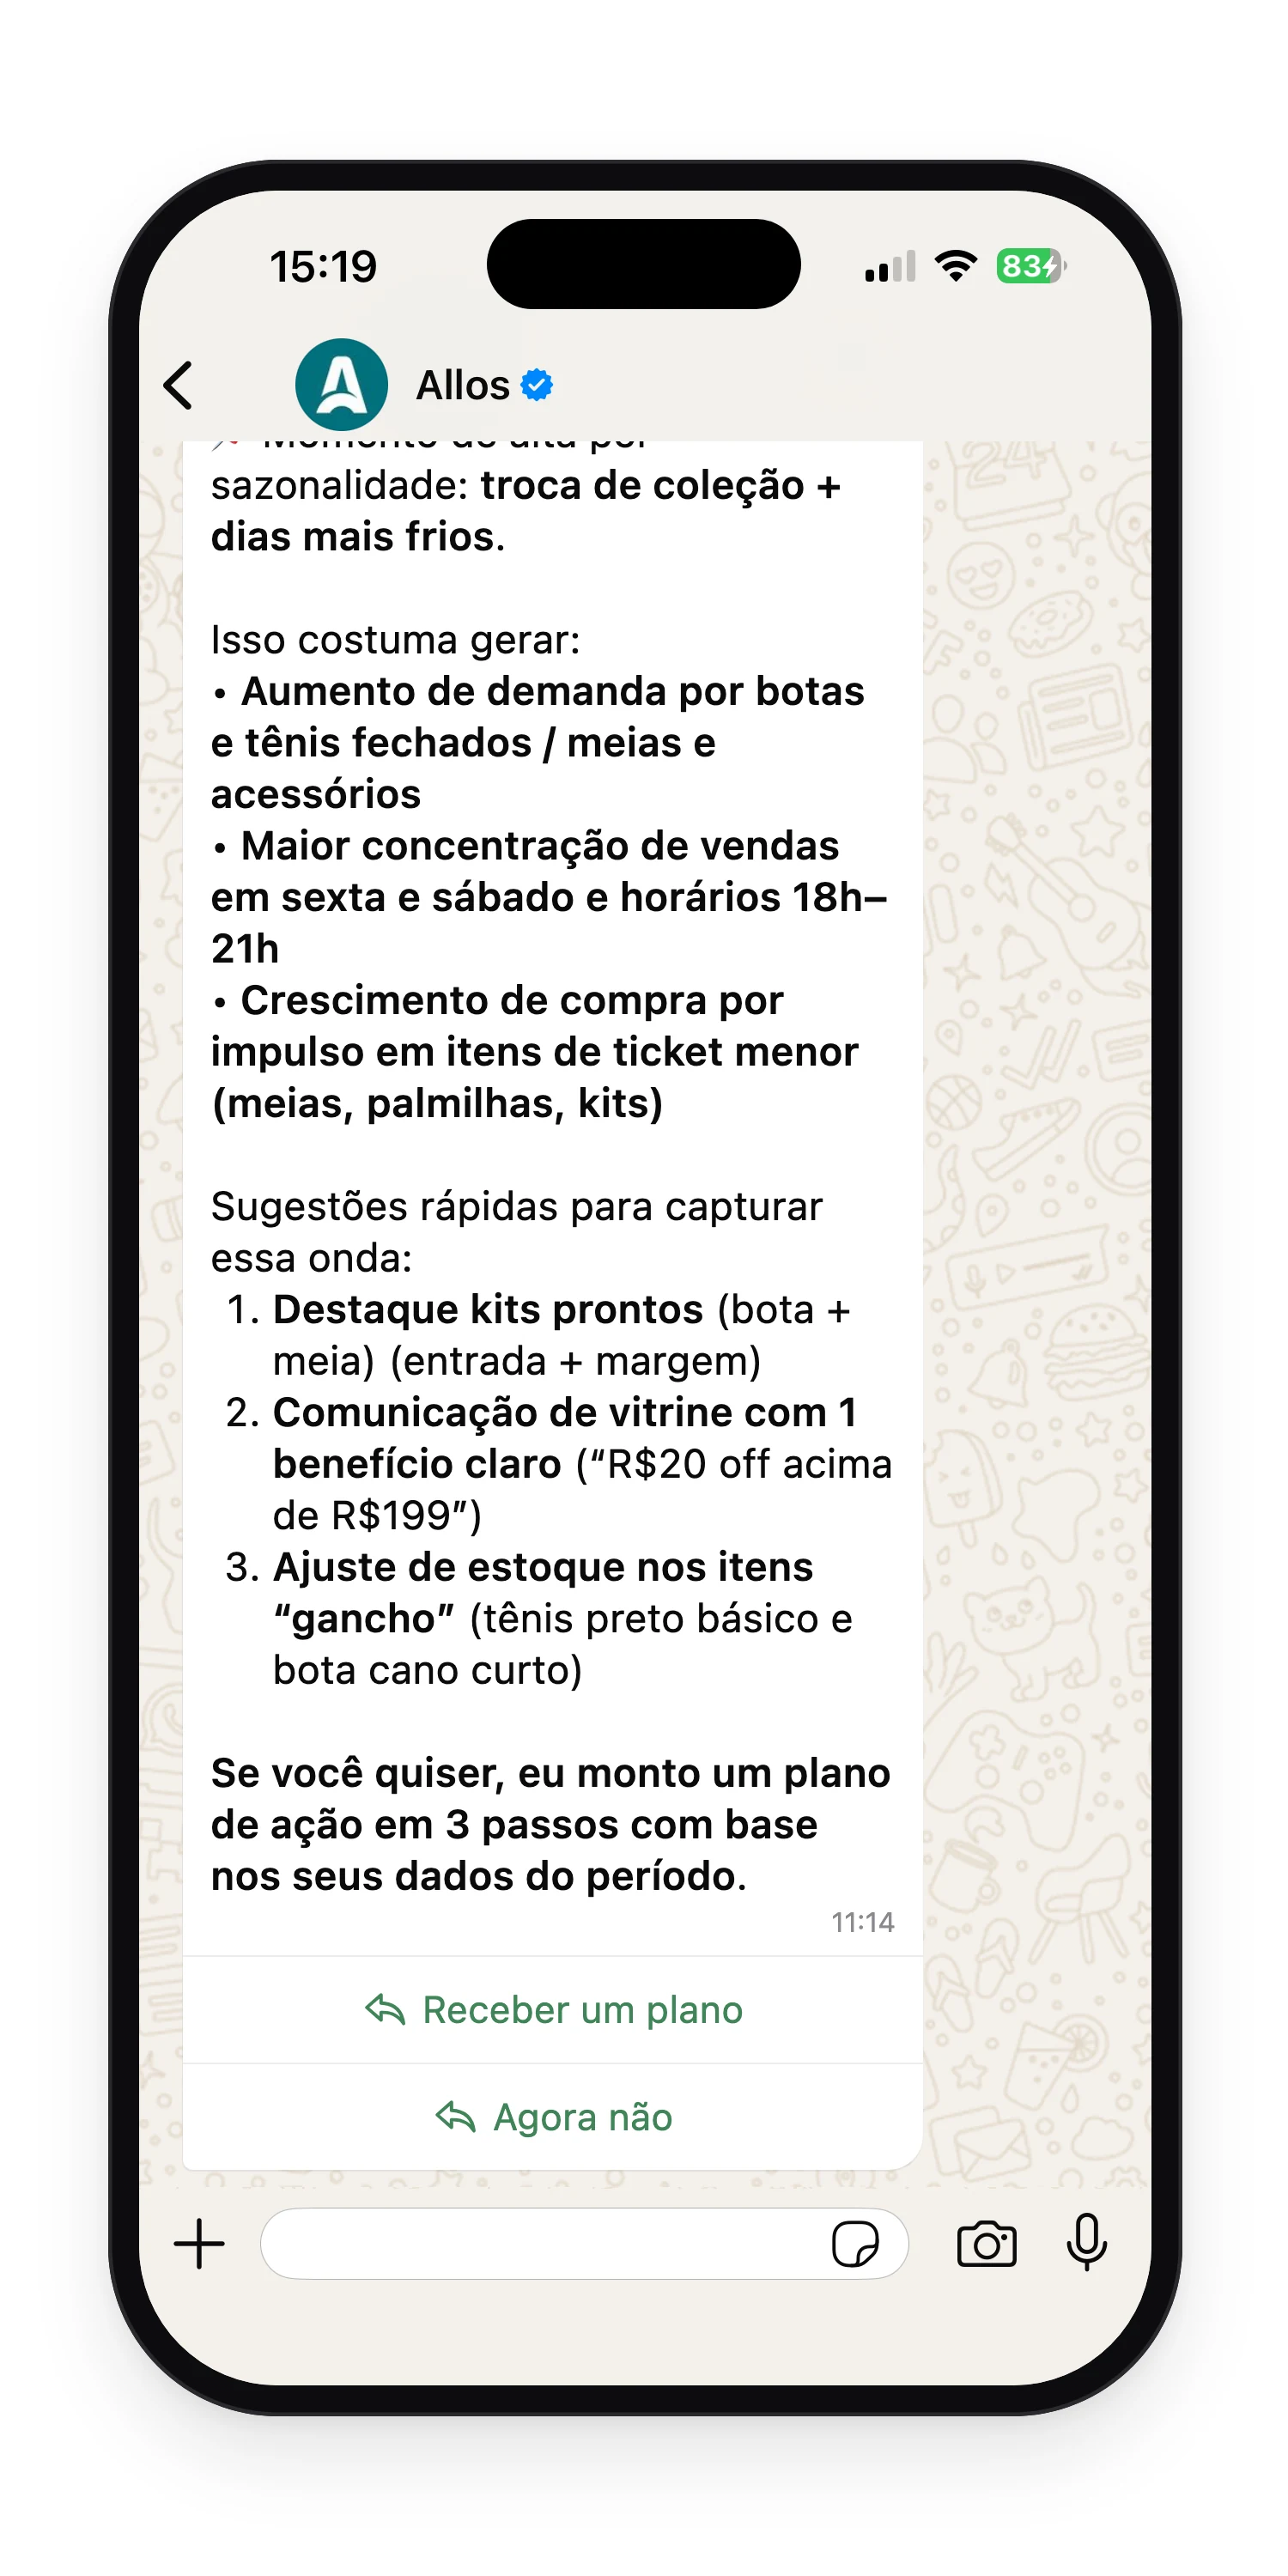
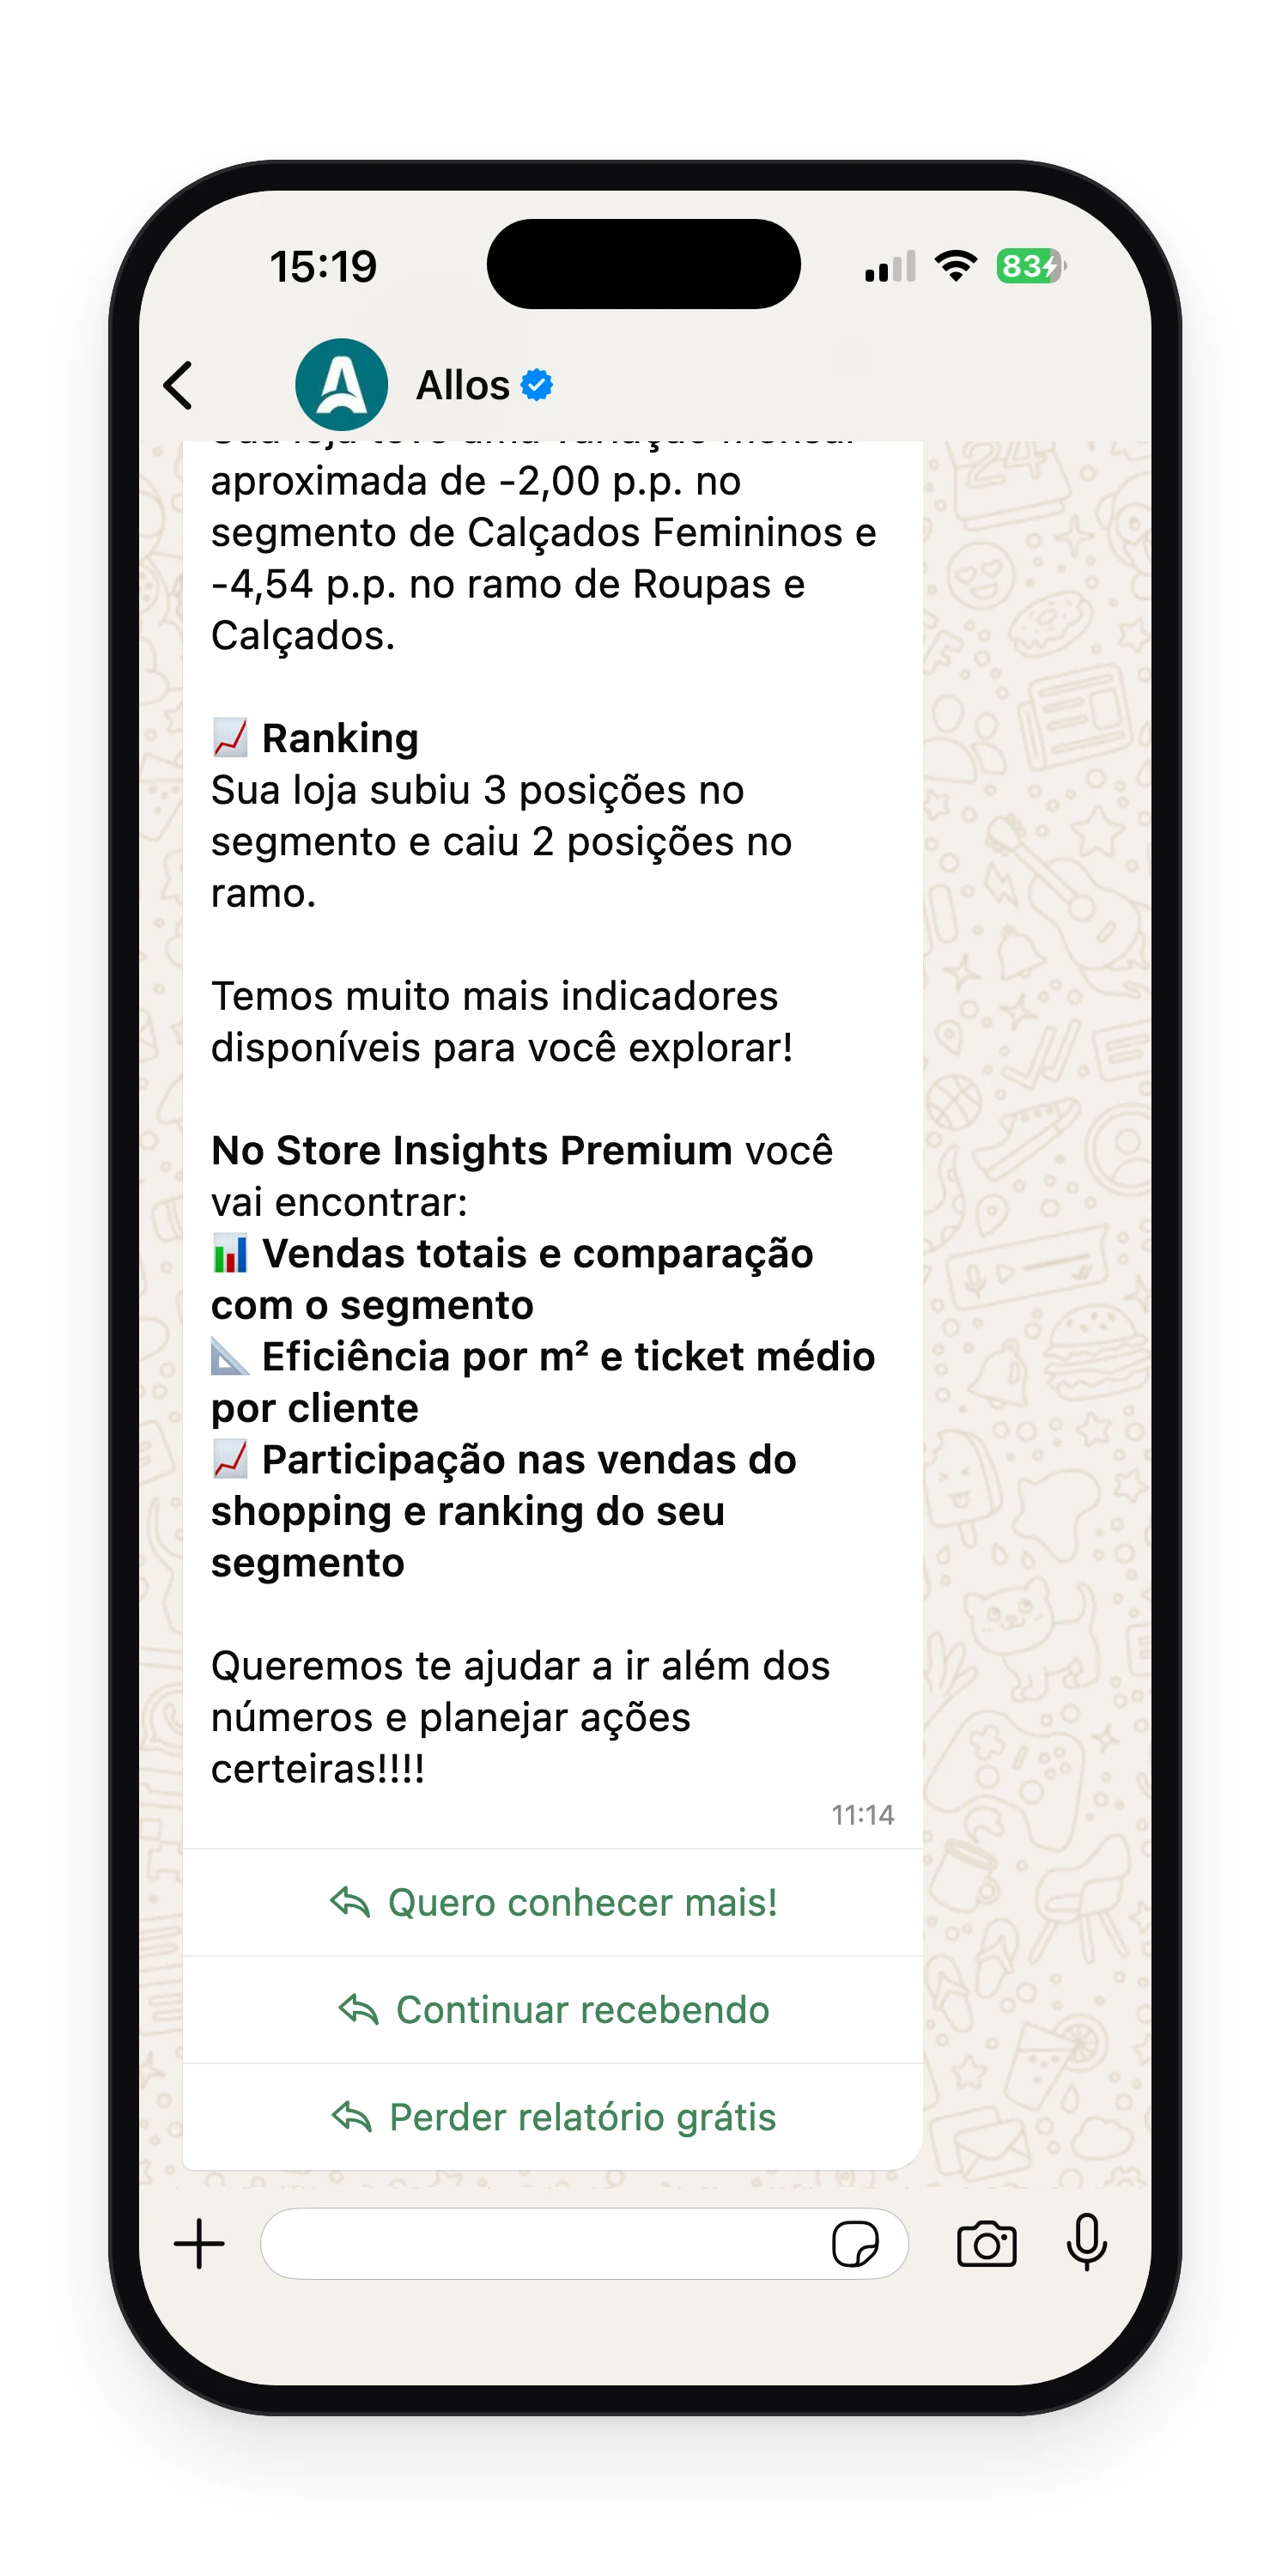
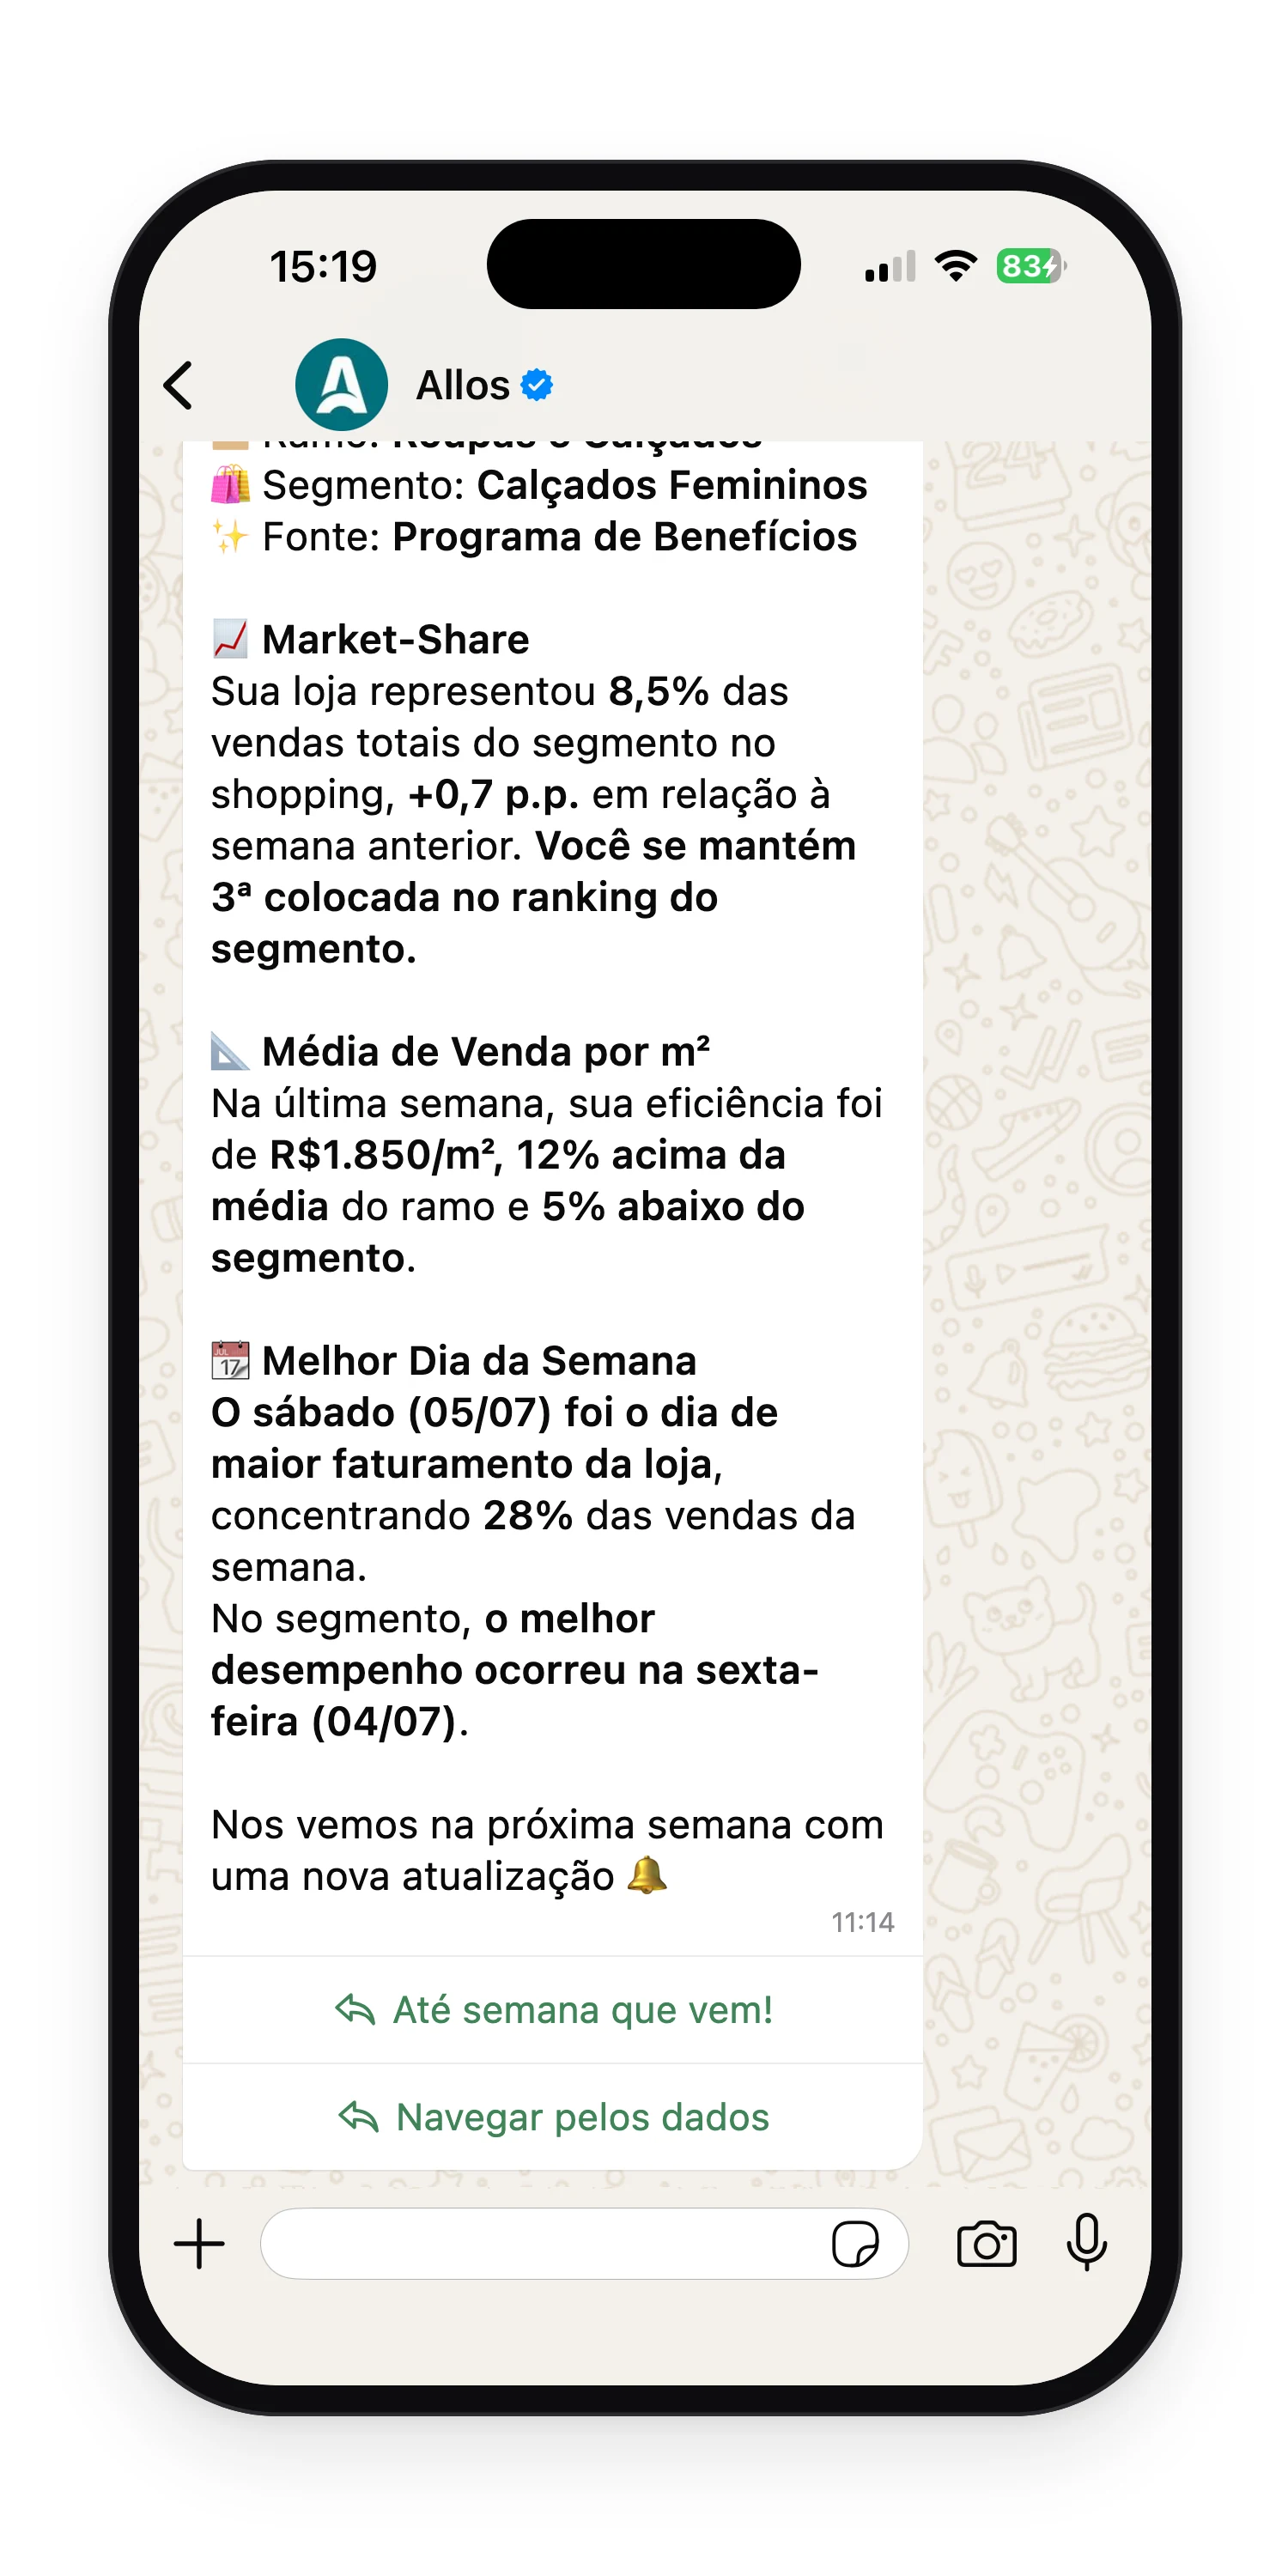
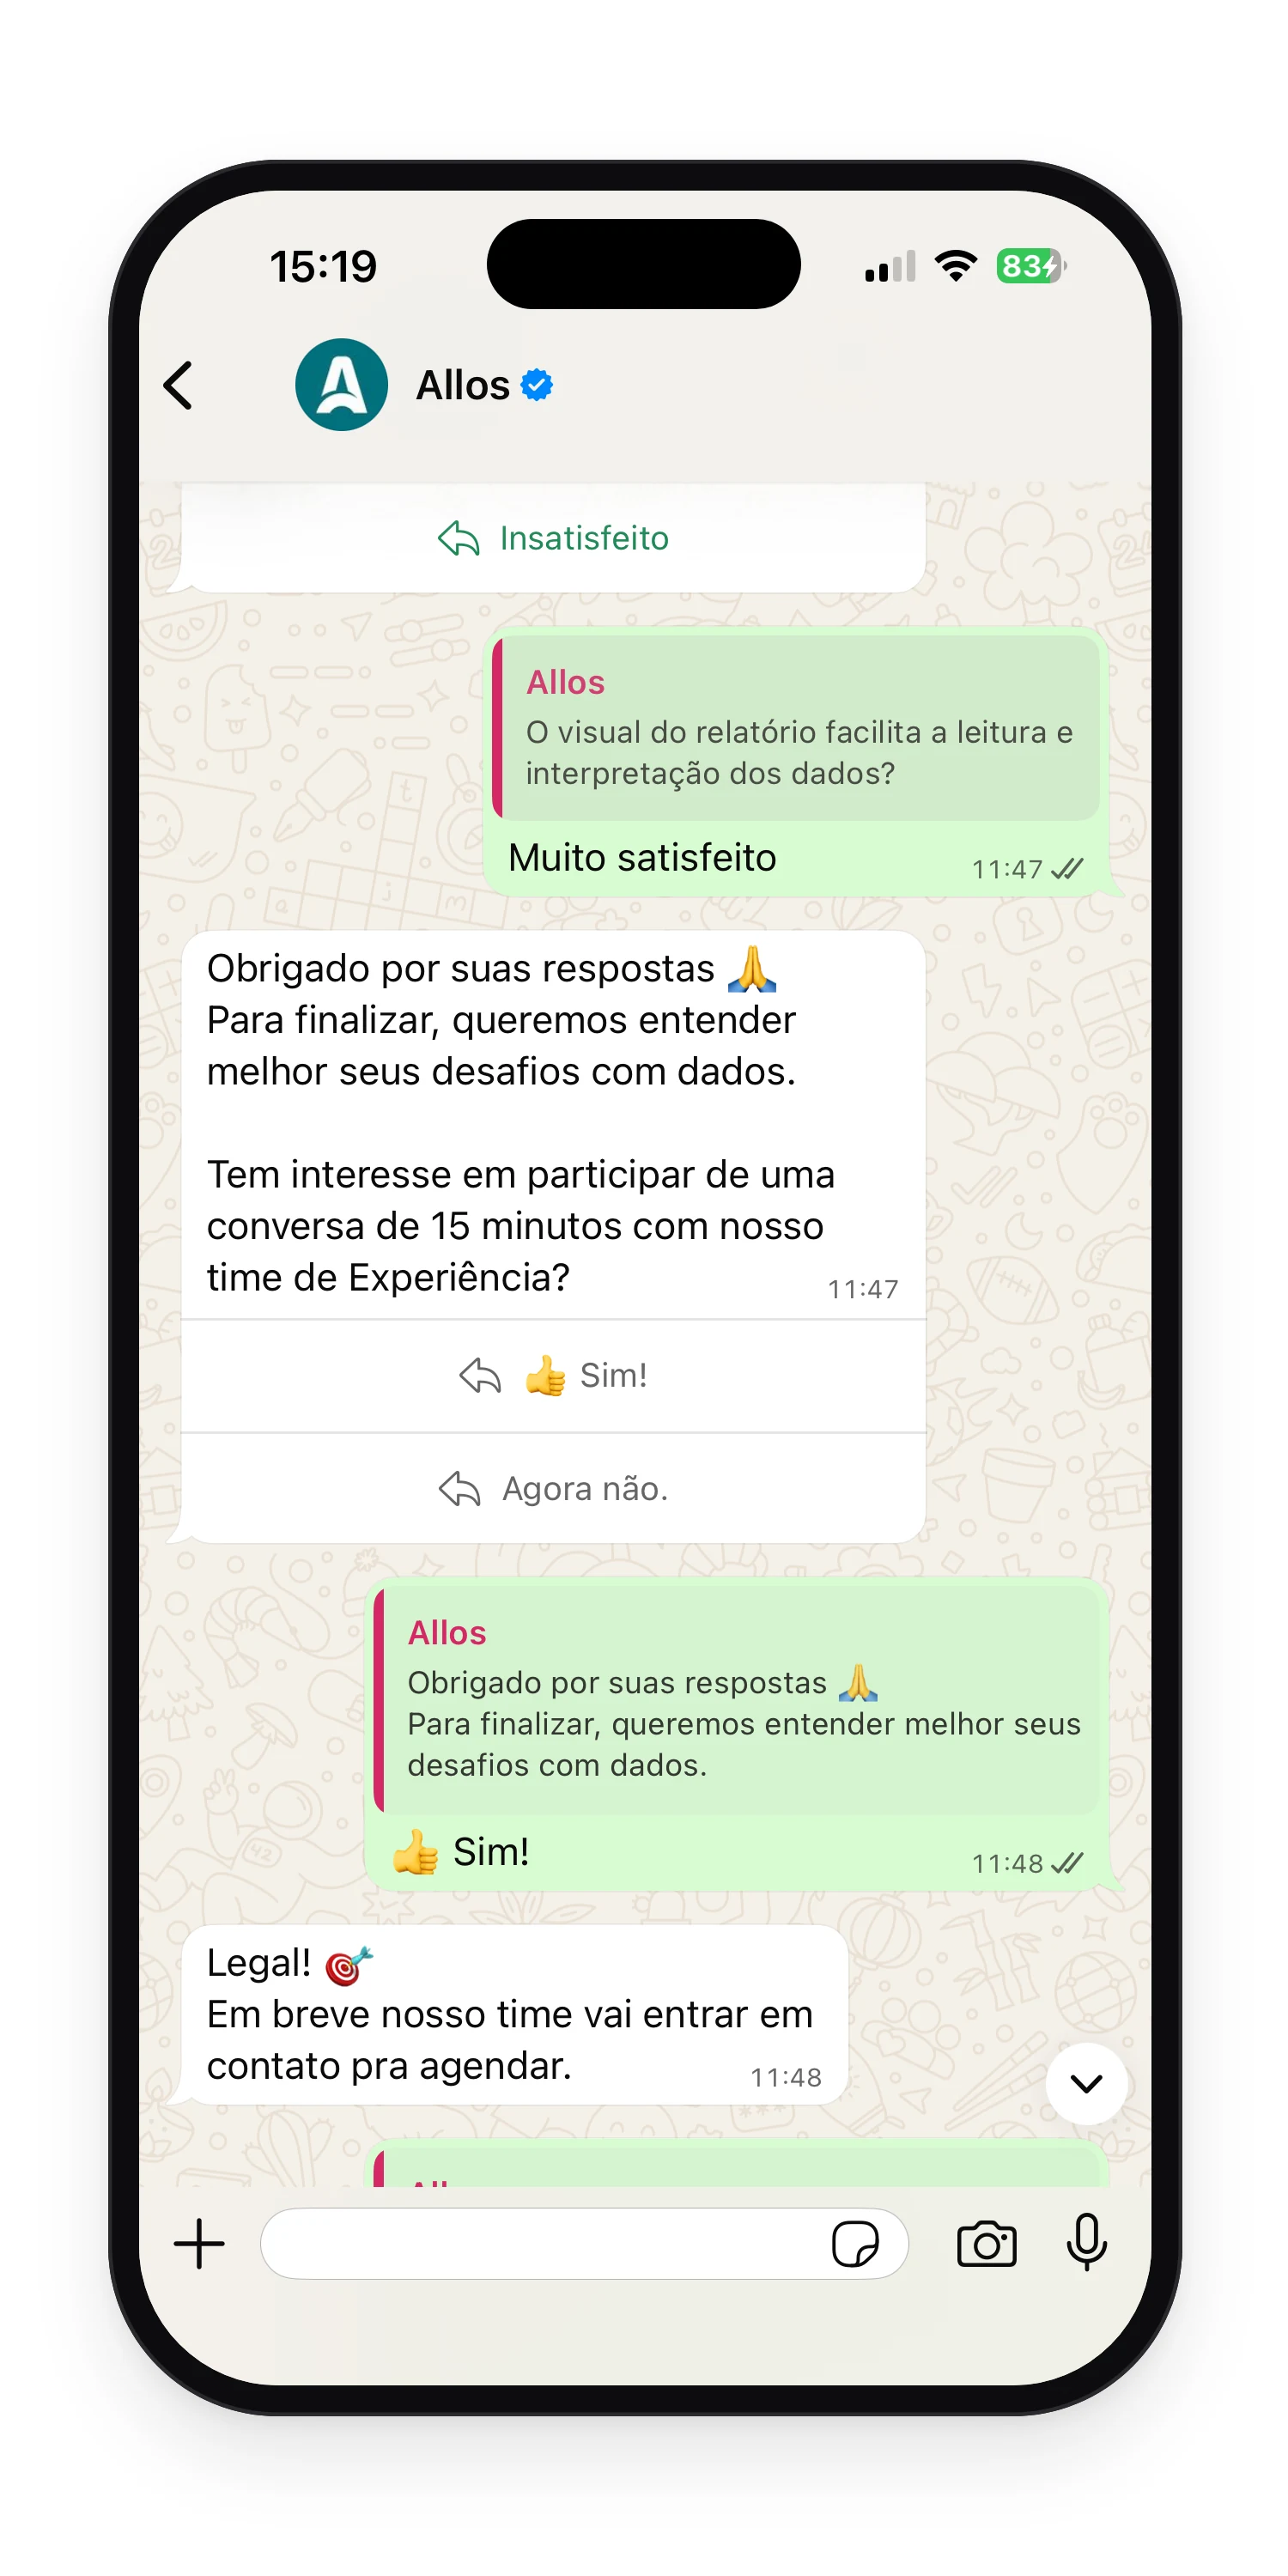
Allan's messages, in the order of the store owner's journey.
Design system
The report and Allan follow the ALLOS identity and use the same data language: the same indicator names, comparison with line of business and segment, and change always shown with sign and unit (%, p.p.).
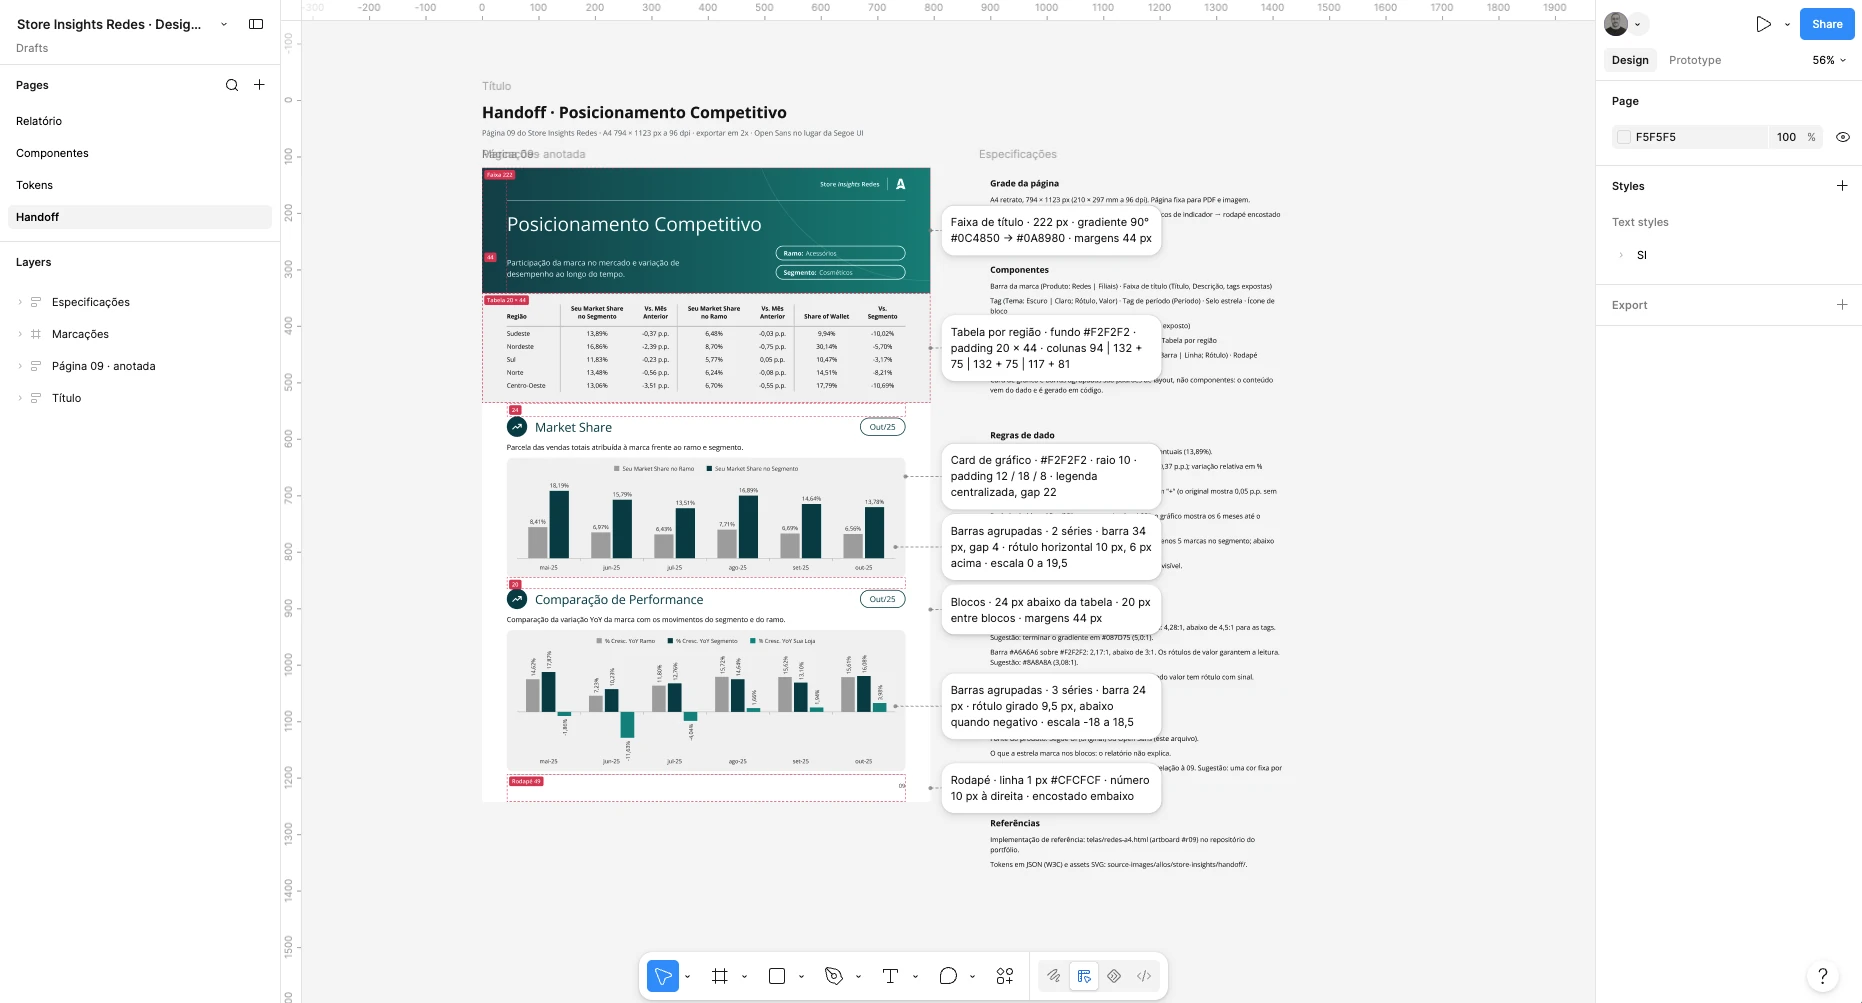
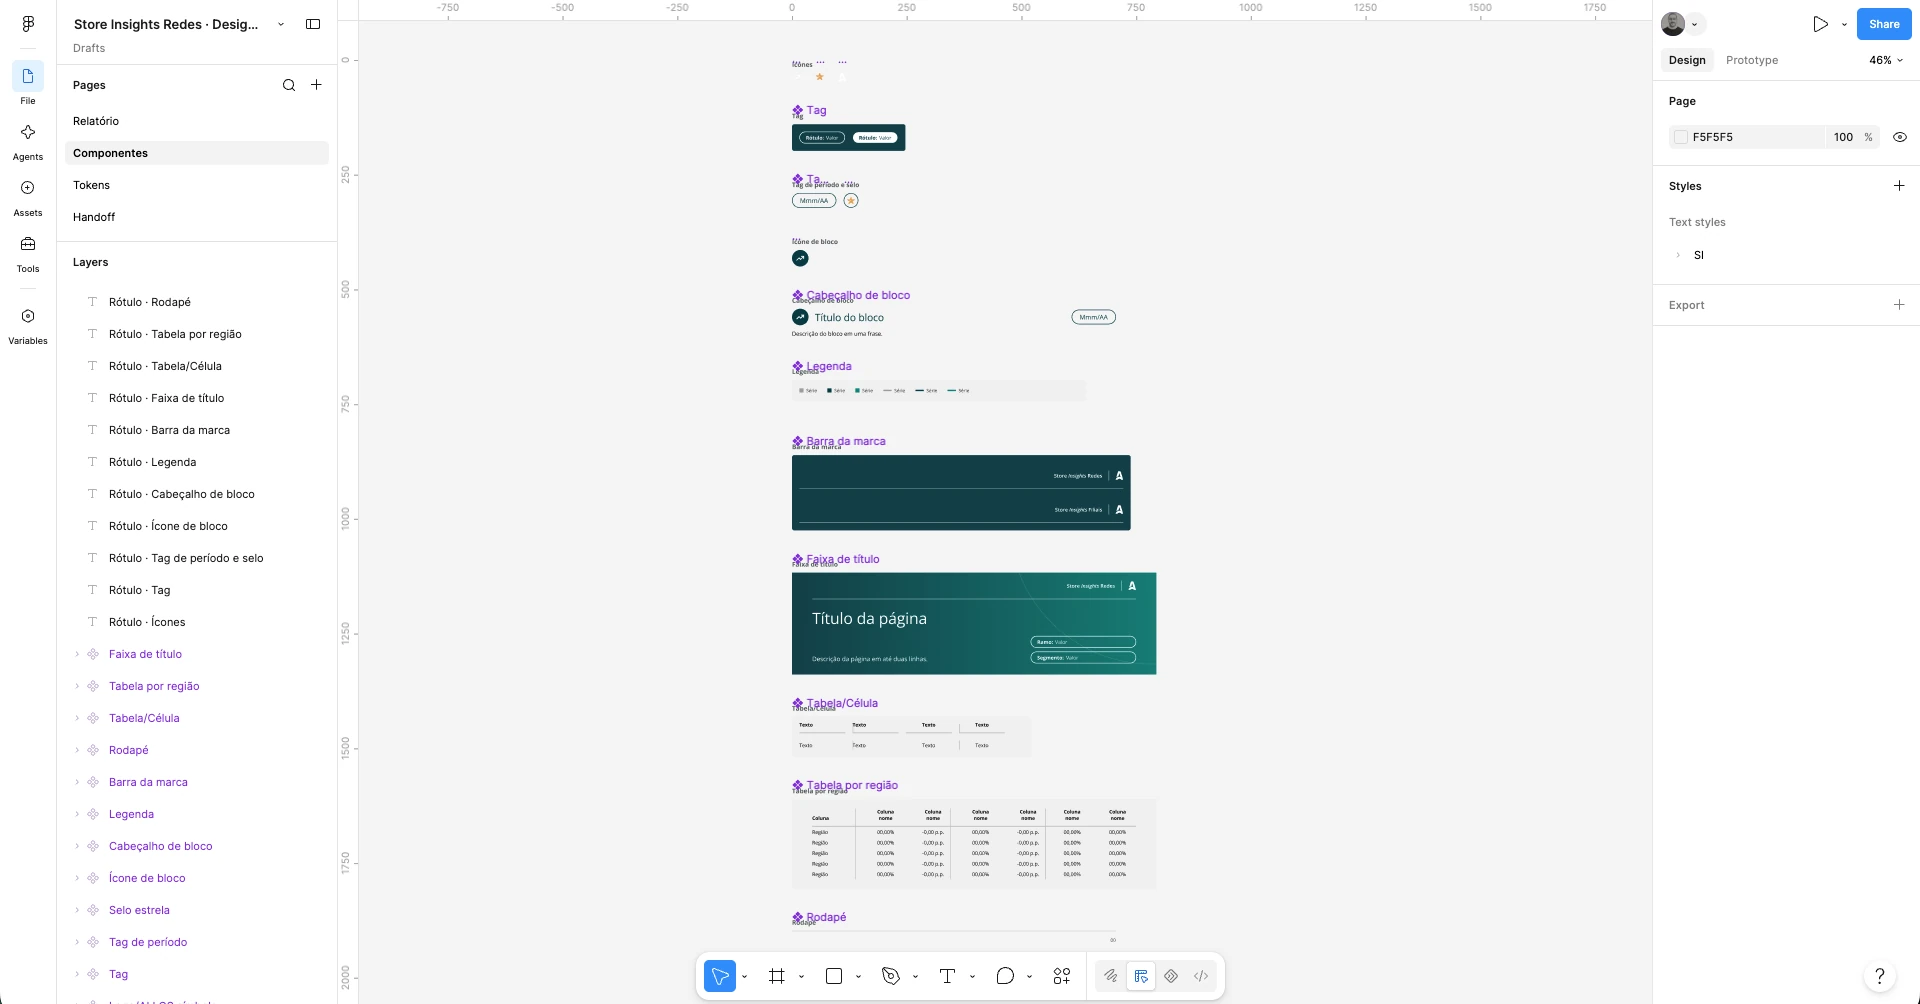
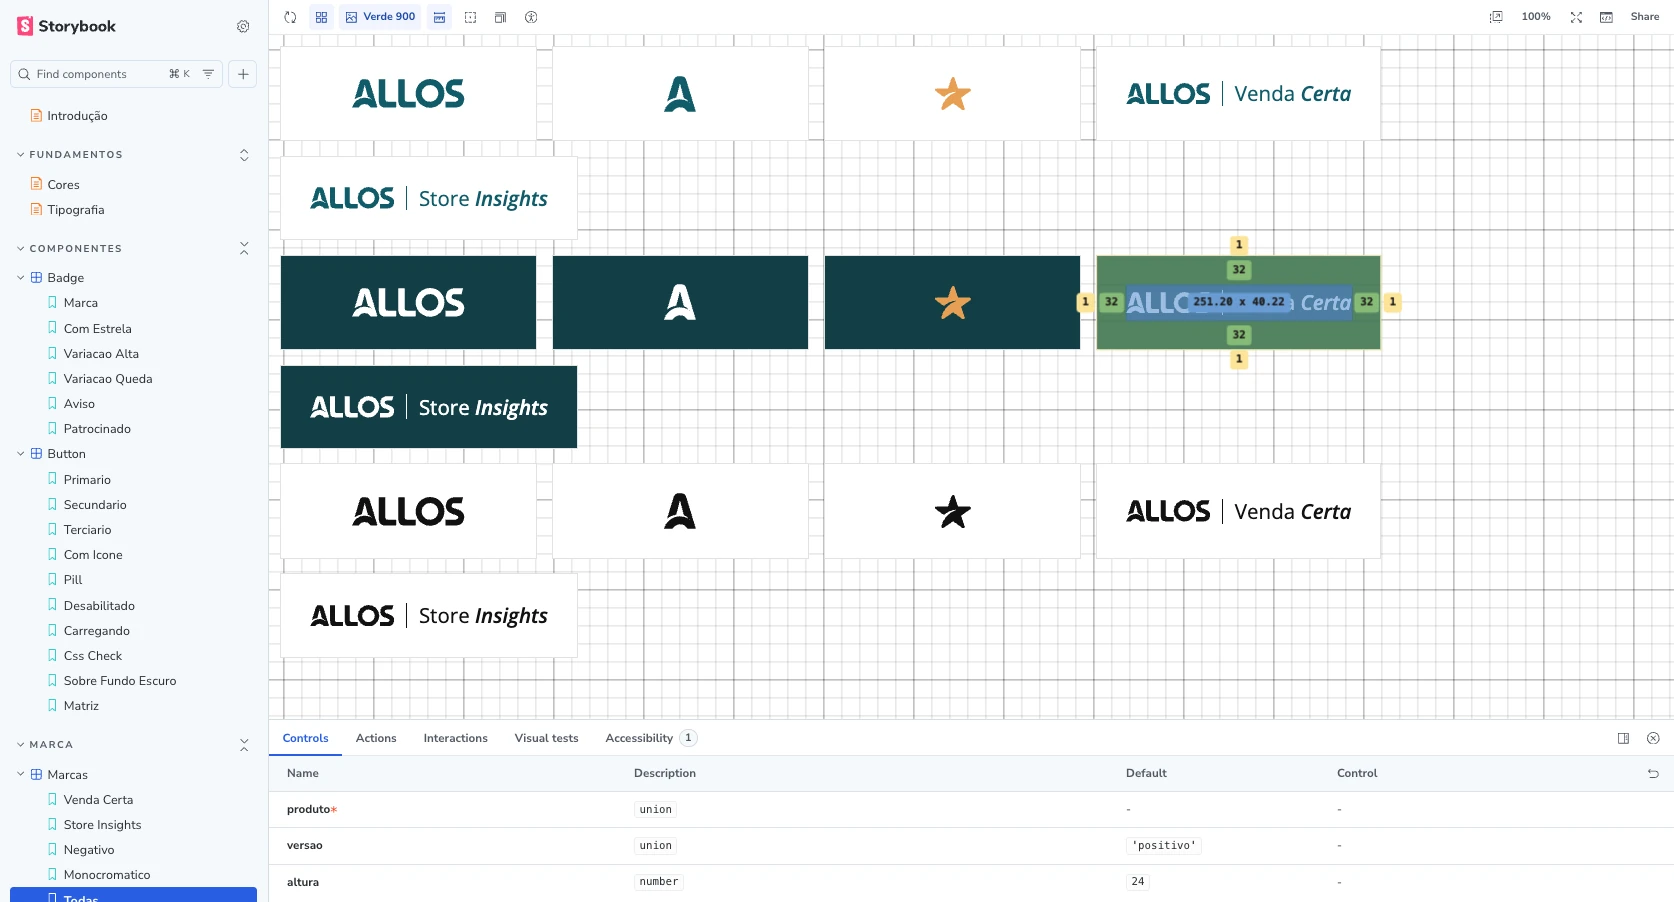
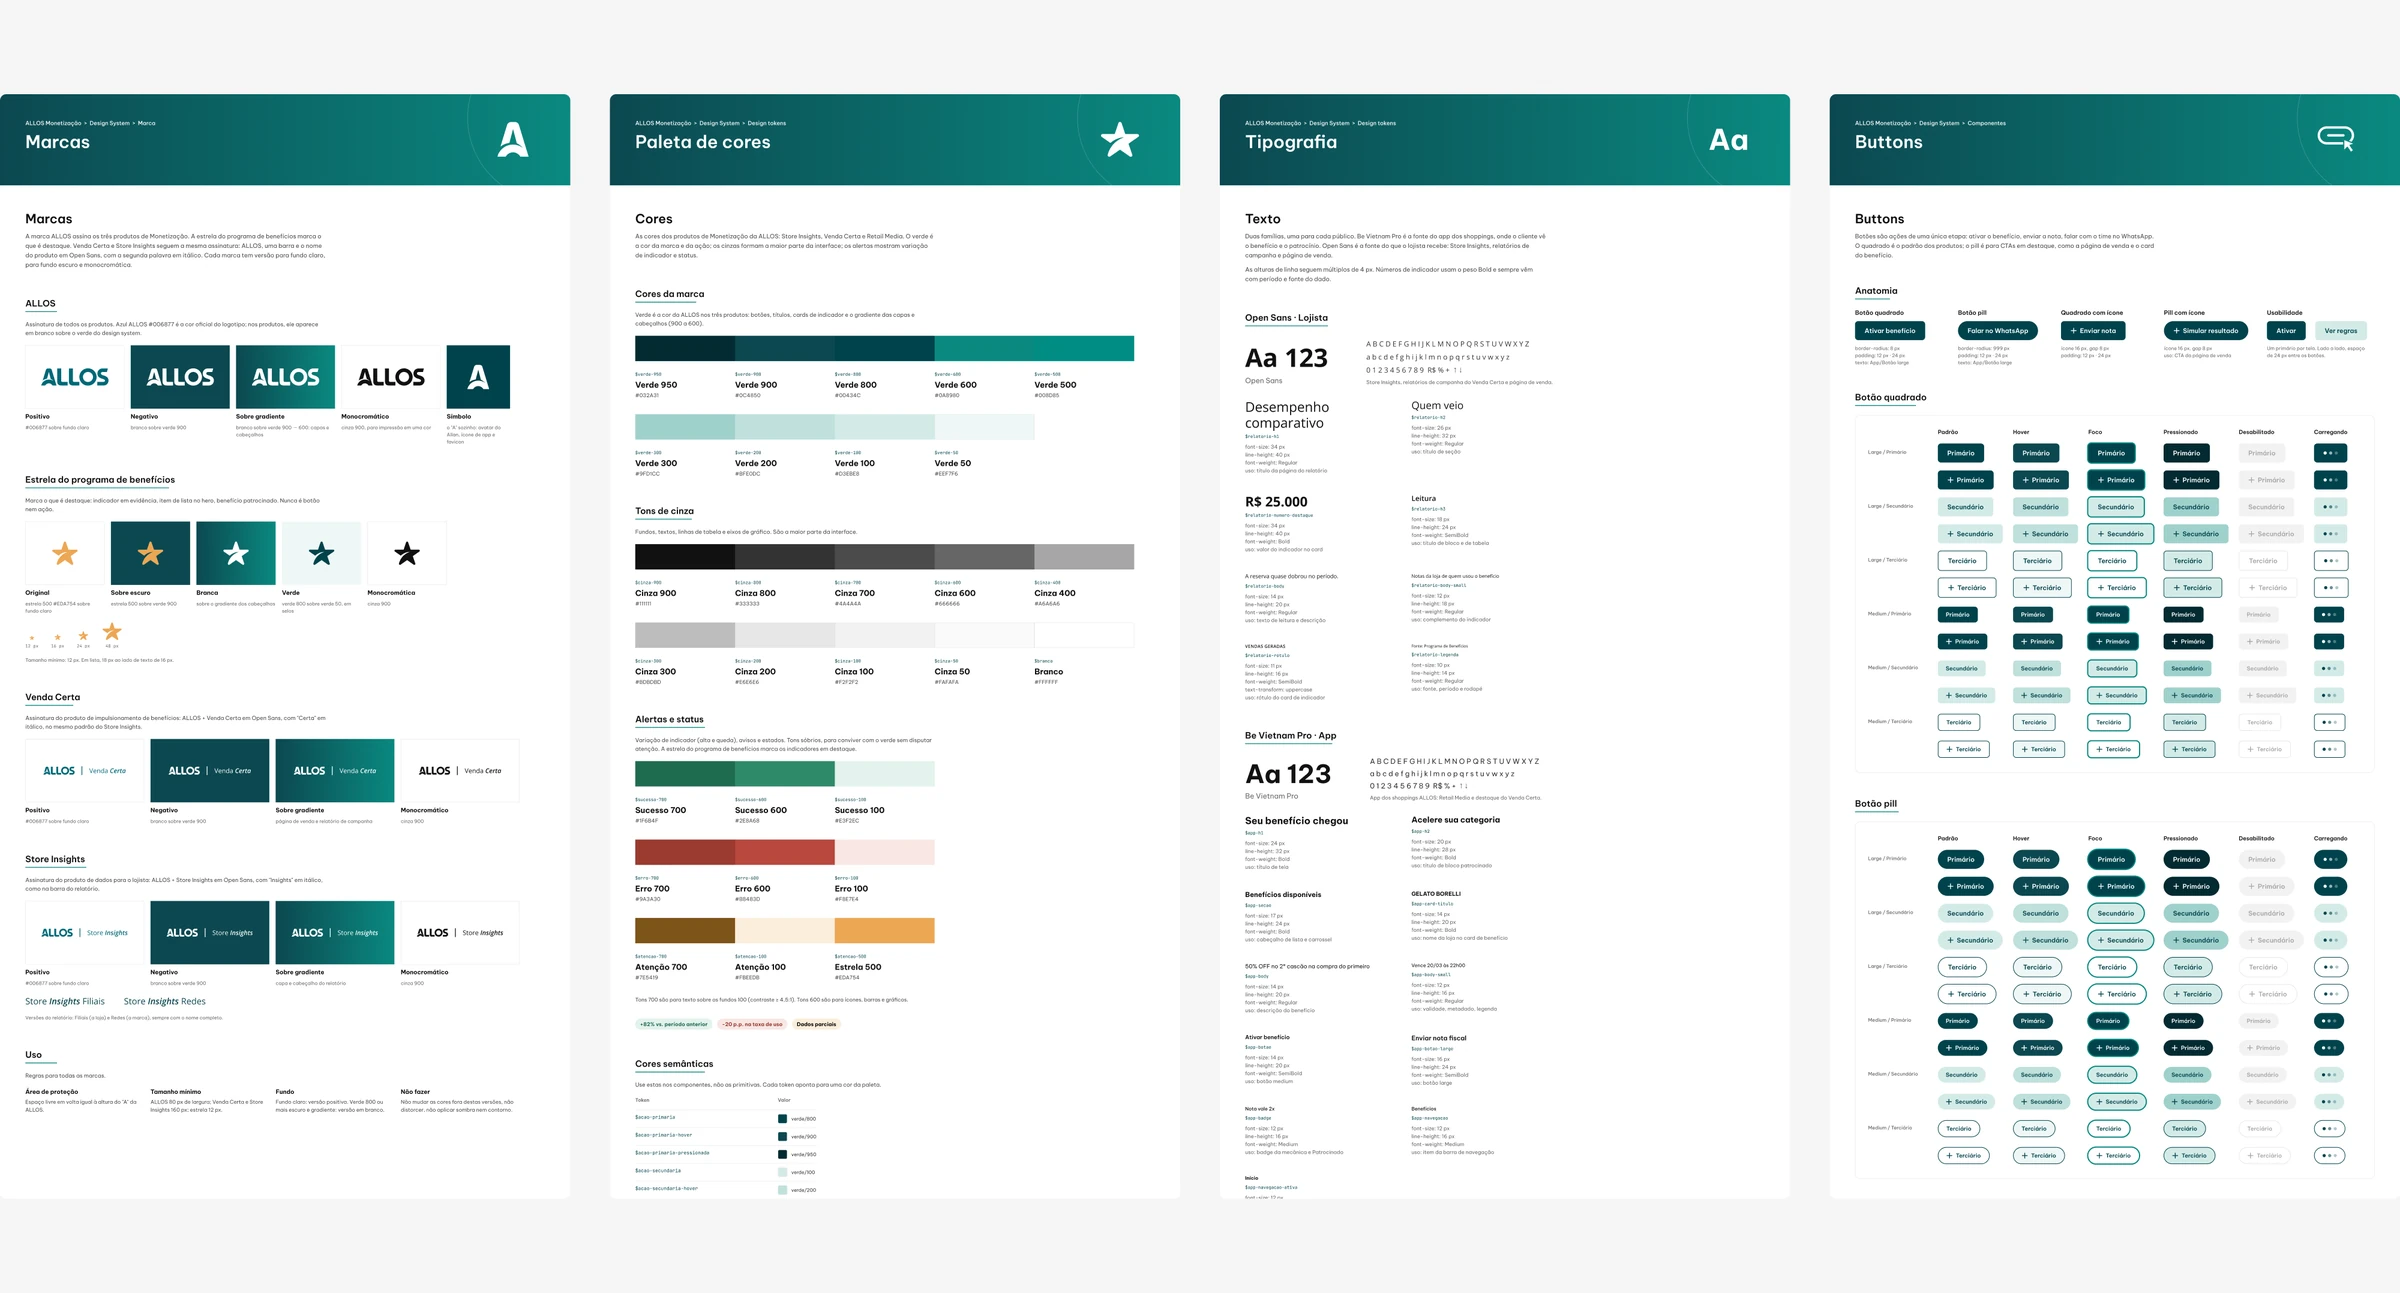
Design system in Figma (handoff and components for Competitive Positioning; Monetization brands, colors, typography and buttons) and in Storybook.
Decisions and trade-offs
- Cutting views from Chains
- High-effort, low-value views were removed until there were enough customers. What stayed got a better explanation.
- Segment as the default comparison
- It is the direct competition. The line of business appears as context.
- Paired metrics
- Each number got the partner that prevents misreading it.
- WhatsApp as the main channel
- Store owners already use WhatsApp every day. The summary reaches them where they are.
- Only promise what the roadmap delivers
- A promise of daily data that never arrived shook trust. I aligned the sales pitch with the roadmap and created a glossary and an explanation of where the data comes from for the sales team.
Roadmap
The syntheses became 24 prioritized recommendations, 8 of them quick wins (in the Results section).
- Now
- Full clarity on metrics, a transparent comparison set, a source badge, weekly and daily data, a market conversion module and Allan 2.0 with open questions.
- Mid term
- Results of campaigns and benefits, year-over-year history, alerts when the segment grows and the store drops, co-consumption and partnerships.
- Vision
- Comparison between the brand's own stores across several markets.
Results
- 3products live: Branches, Chains and Allan
- 102research records that became backlog and sales pitch
- 24prioritized recommendations, 8 quick wins
- R$ 322Kin Monetization revenue from January to June 2026, with 145 campaigns and 10 clients
The product went from a monthly PDF to weekly tracking, on the store owner's own channel, with every number explained.
Learnings
- ContextIn a data product, period, source and comparison have to be on screen. Without them, store owners don't trust the number.
- ChannelA report store owners don't open doesn't change any decision, which is why the channel matters as much as the content.
- SalesWhen sales promises what the roadmap doesn't deliver, the interface loses the trust it built. Design also started reviewing the sales pitch.