Case 02 · UX Research
Next
User research and personas for an IoT solution that monitors medication temperature in hospitals.

About Next
Next was created to reduce the strain of manual work and processes, redirecting that time to activities that really matter and giving its customers peace of mind by connecting them in a simple, intuitive and smart way.
Today Next's portfolio includes a range of IoT and technology applications based on tracking and managing objects with RFID and Smart Tags. These solutions let customers monitor any object with a small tag equipped with sensors that capture many kinds of information, such as real-time temperature and humidity of equipment and rooms, without conventional thermo-hygrometers or paper logs.
Context
The digital transformation of healthcare started years ago, but the main advances have been in diagnostic and surgical equipment.
Countless processes and procedures still rely entirely on manual work, prone to human error and very time-consuming.
- R$ 1 billionin medication wasted every year in Brazil
- 6,7%of Brazilian hospitals report significant losses of supplies due to temperature deviations in storage
- US$ 35 billionin medication losses in the cold chain in 2015, according to an estimate by CargoSense
Temperature is the most important factor in the degradation of pharmaceutical products: as temperature rises, chemical degradation increases.
Goals
- Describe the product persona. Research users and the market to define the best platform for consuming data and using the system (mobile or desktop), based on engagement and the customer's context.
- For the mobile application, gather data showing whether users prefer a native app (iOS, Android etc.) or whether accessing the platform on the mobile web is enough, given the system's range of features.
- Conclude which platform and which UX are best for the product in the healthcare market, based on data collected from the market itself, from users and from customers.
Process
From research to application, the process was split into 4 stages.
- 01
Exploratory research and hypotheses
Understand which goals Next could reach with the current product, get to know potential users and the routine of the professional in charge of temperature control, and write an interview script based on the scenario found in desk research.
- 02
User interviews
In person, by phone and through an online survey, refining the questionnaire and visiting the workplace.
- 03
Defining the persona and the platform
- 04
Application
What kind of technology and service Next could offer with the product in its expansion phase.
Hypotheses
Desk research surfaced a few possible problems.
- Poor equipment. Sources: Folha de Londrina and G1 Amazonas.
- Lack of investment in technology. Source: Saúde Business.
…healthcare systems that don't invest in technology usually show several inefficiencies…
The solutions on the market seem to follow a common-sense pattern of what needs to be done: control temperature and humidity, prevent bacteria from spreading, “have great air conditioning” and automate processes. Overall, different technology companies are offering the same answer.
Interviews
The first reaction was positive: we introduced ourselves as students and explained how the program worked. But once the topic came up, the mood changed completely and the interviewees became very wary and suspicious.
We're told not to talk to companies.
In-person interviews were held at 2 hospitals, and the equipment situation was the same in both.
Both interviews were with women, pharmacists with postgraduate degrees. The main pain points they raised were the lack of investment in equipment and the absence of staff at the unit on weekends, which makes power outages a big problem.
Survey research
We collected 18 responses on Google Forms, 2 of them by phone. A second survey was needed to follow up on answers from the first form.
Both surveys had 2 sections. The first covered personal details (name, age, education, job title, marital status…). The second was aimed at building the empathy map and the persona's story (hobbies, habits, family, friends, personal goals).
Personas
The personas were split into two categories: the management profile and the operational profile.
The management profile covers professionals in senior roles, who make decisions and influence the purchase and rollout of new technology. They aren't in direct contact with temperature control, but they answer for it if something goes wrong.
Application
After the second industrial revolution, with mass production, and the digital revolution, which automated processes, Industry 4.0 emerges as the natural path to make the sector more competitive through digital technologies that cover automation and data exchange, with concepts such as Machine Learning, IoT and Cloud Computing.
Next's current system shows the same information as other players on the market, and it is also reactive, with alerts only after a deviation happens.
In this innovation project, we suggested moving to an active solution, in line with Industry 4.0, where one more piece of information is added to what users monitor: the probability that the temperature will go beyond the set limits. That way the solution stops being reactive and makes preventive action possible.
Development would happen in Next's system, adding a Machine Learning tool. The hardware would stay the same.
Interface
Based on the discovery, I designed 3 dashboard screens for the active prevention proposal: one for managers, one for whoever operates the equipment and one for the incident that used to be discovered only on Monday.
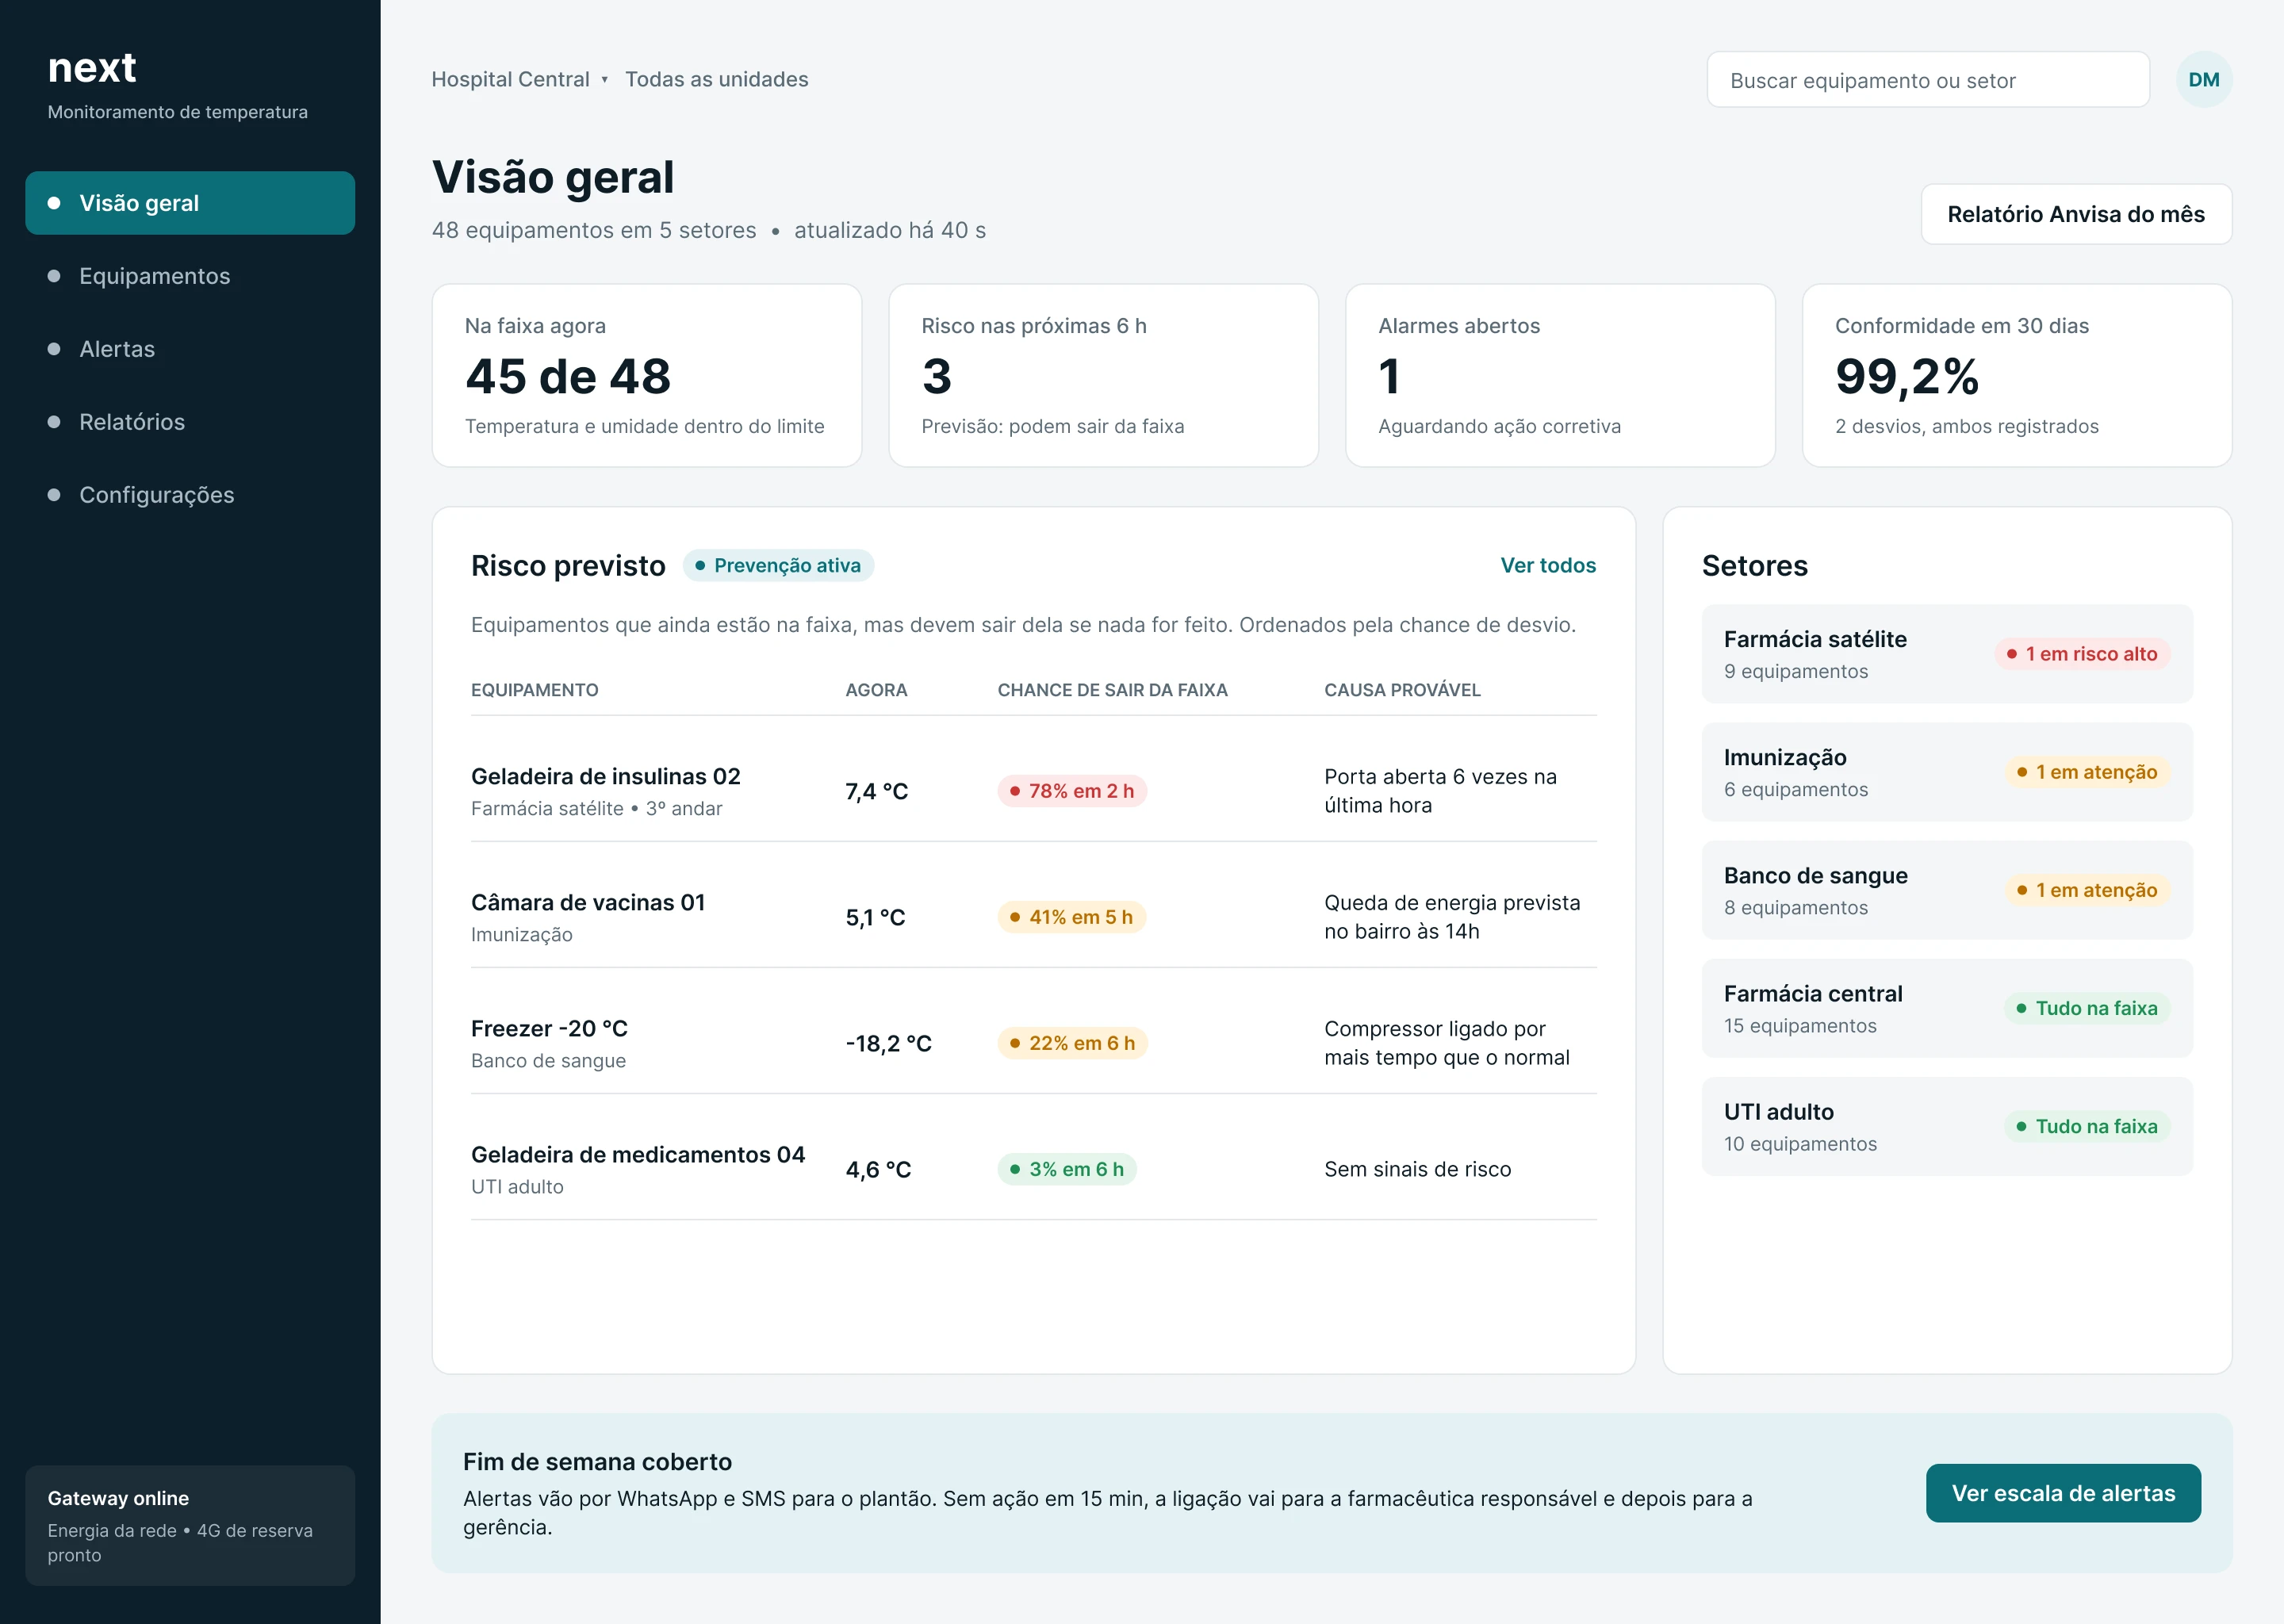
- Indicators at the top: how many devices are in range, how many are at risk in the next 6 hours, open alarms and compliance over the last 30 days.
- Active prevention: a “Predicted risk” table lists the devices still in range that are likely to leave it, with the likelihood and probable cause. This is the core of the case: warn before the deviation, not after.
- Departments and on-call: the status of each department and a banner about the weekend, with the schedule of who gets notified and through which channel.
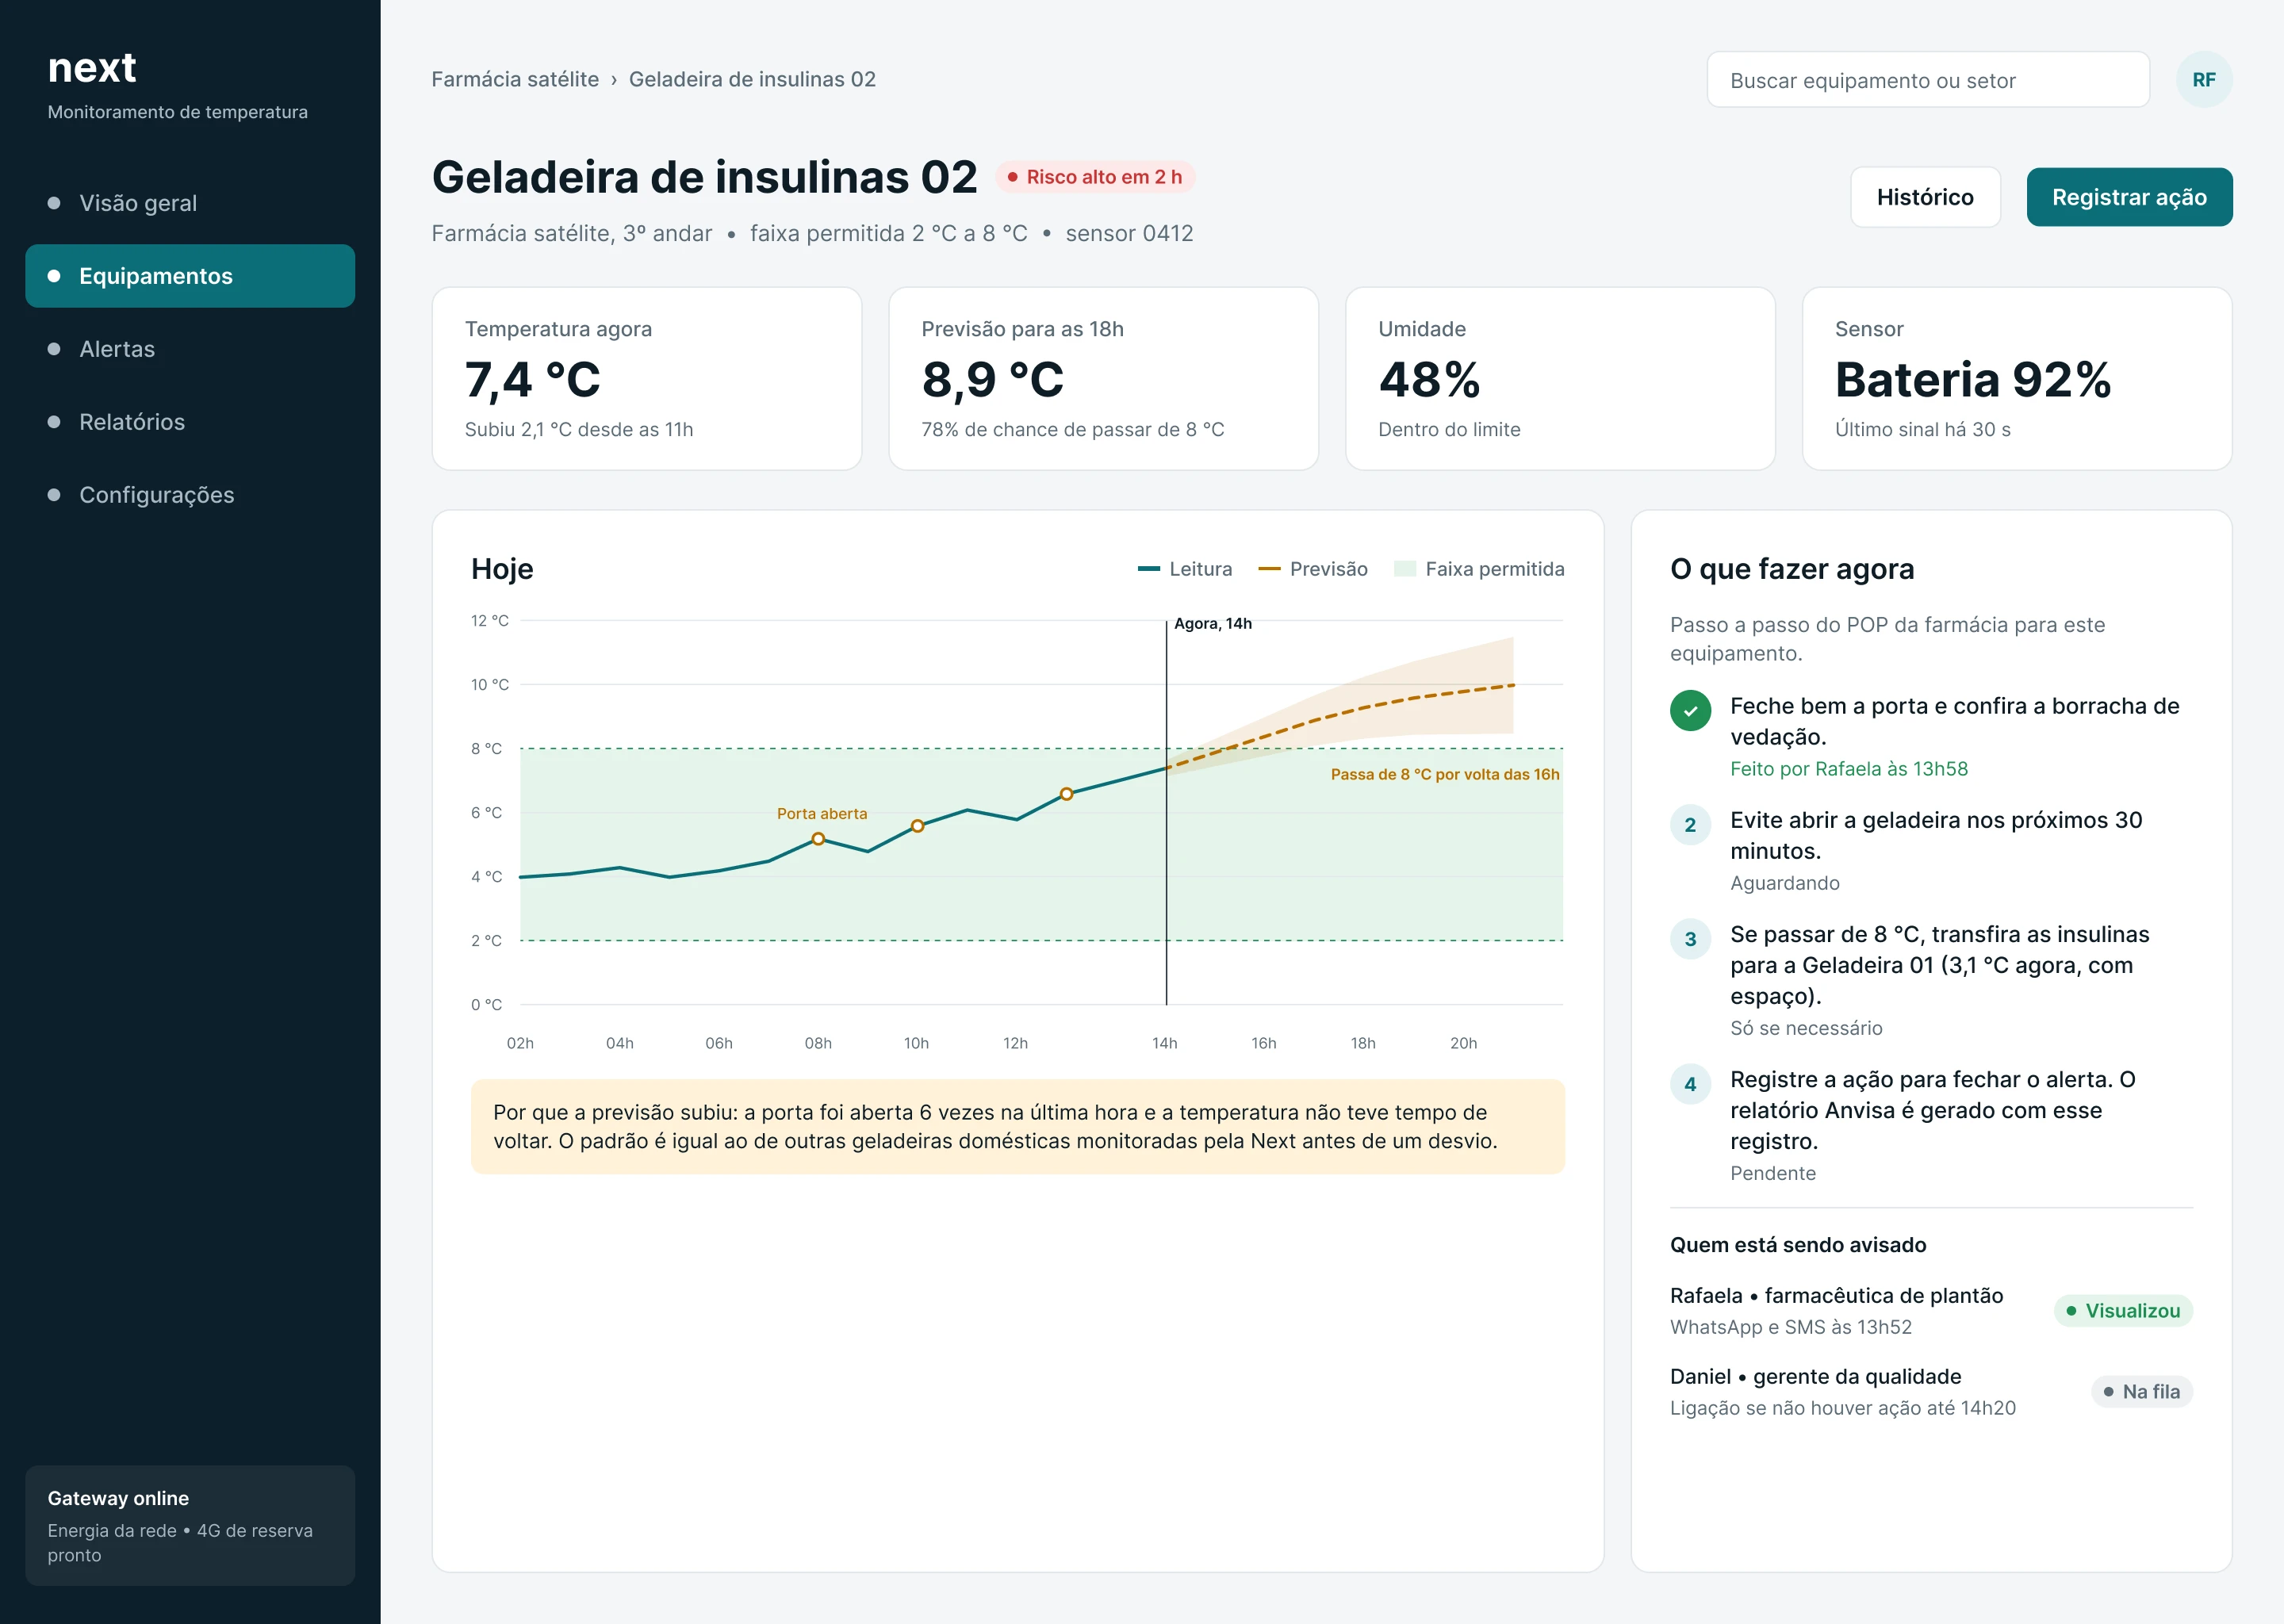
- The day's chart: the 2 to 8 °C range, the actual reading, the dashed forecast with its margin of uncertainty and the moments the door was opened.
- Cause explained: a short text says why the risk went up. It answers the “the alarm doesn't say what caused it” pain point.
- “What to do now”: a step-by-step guide, which was Fernanda's goal (a manual for what to do in each situation), and the list of who is being notified and who steps in if nobody acts.
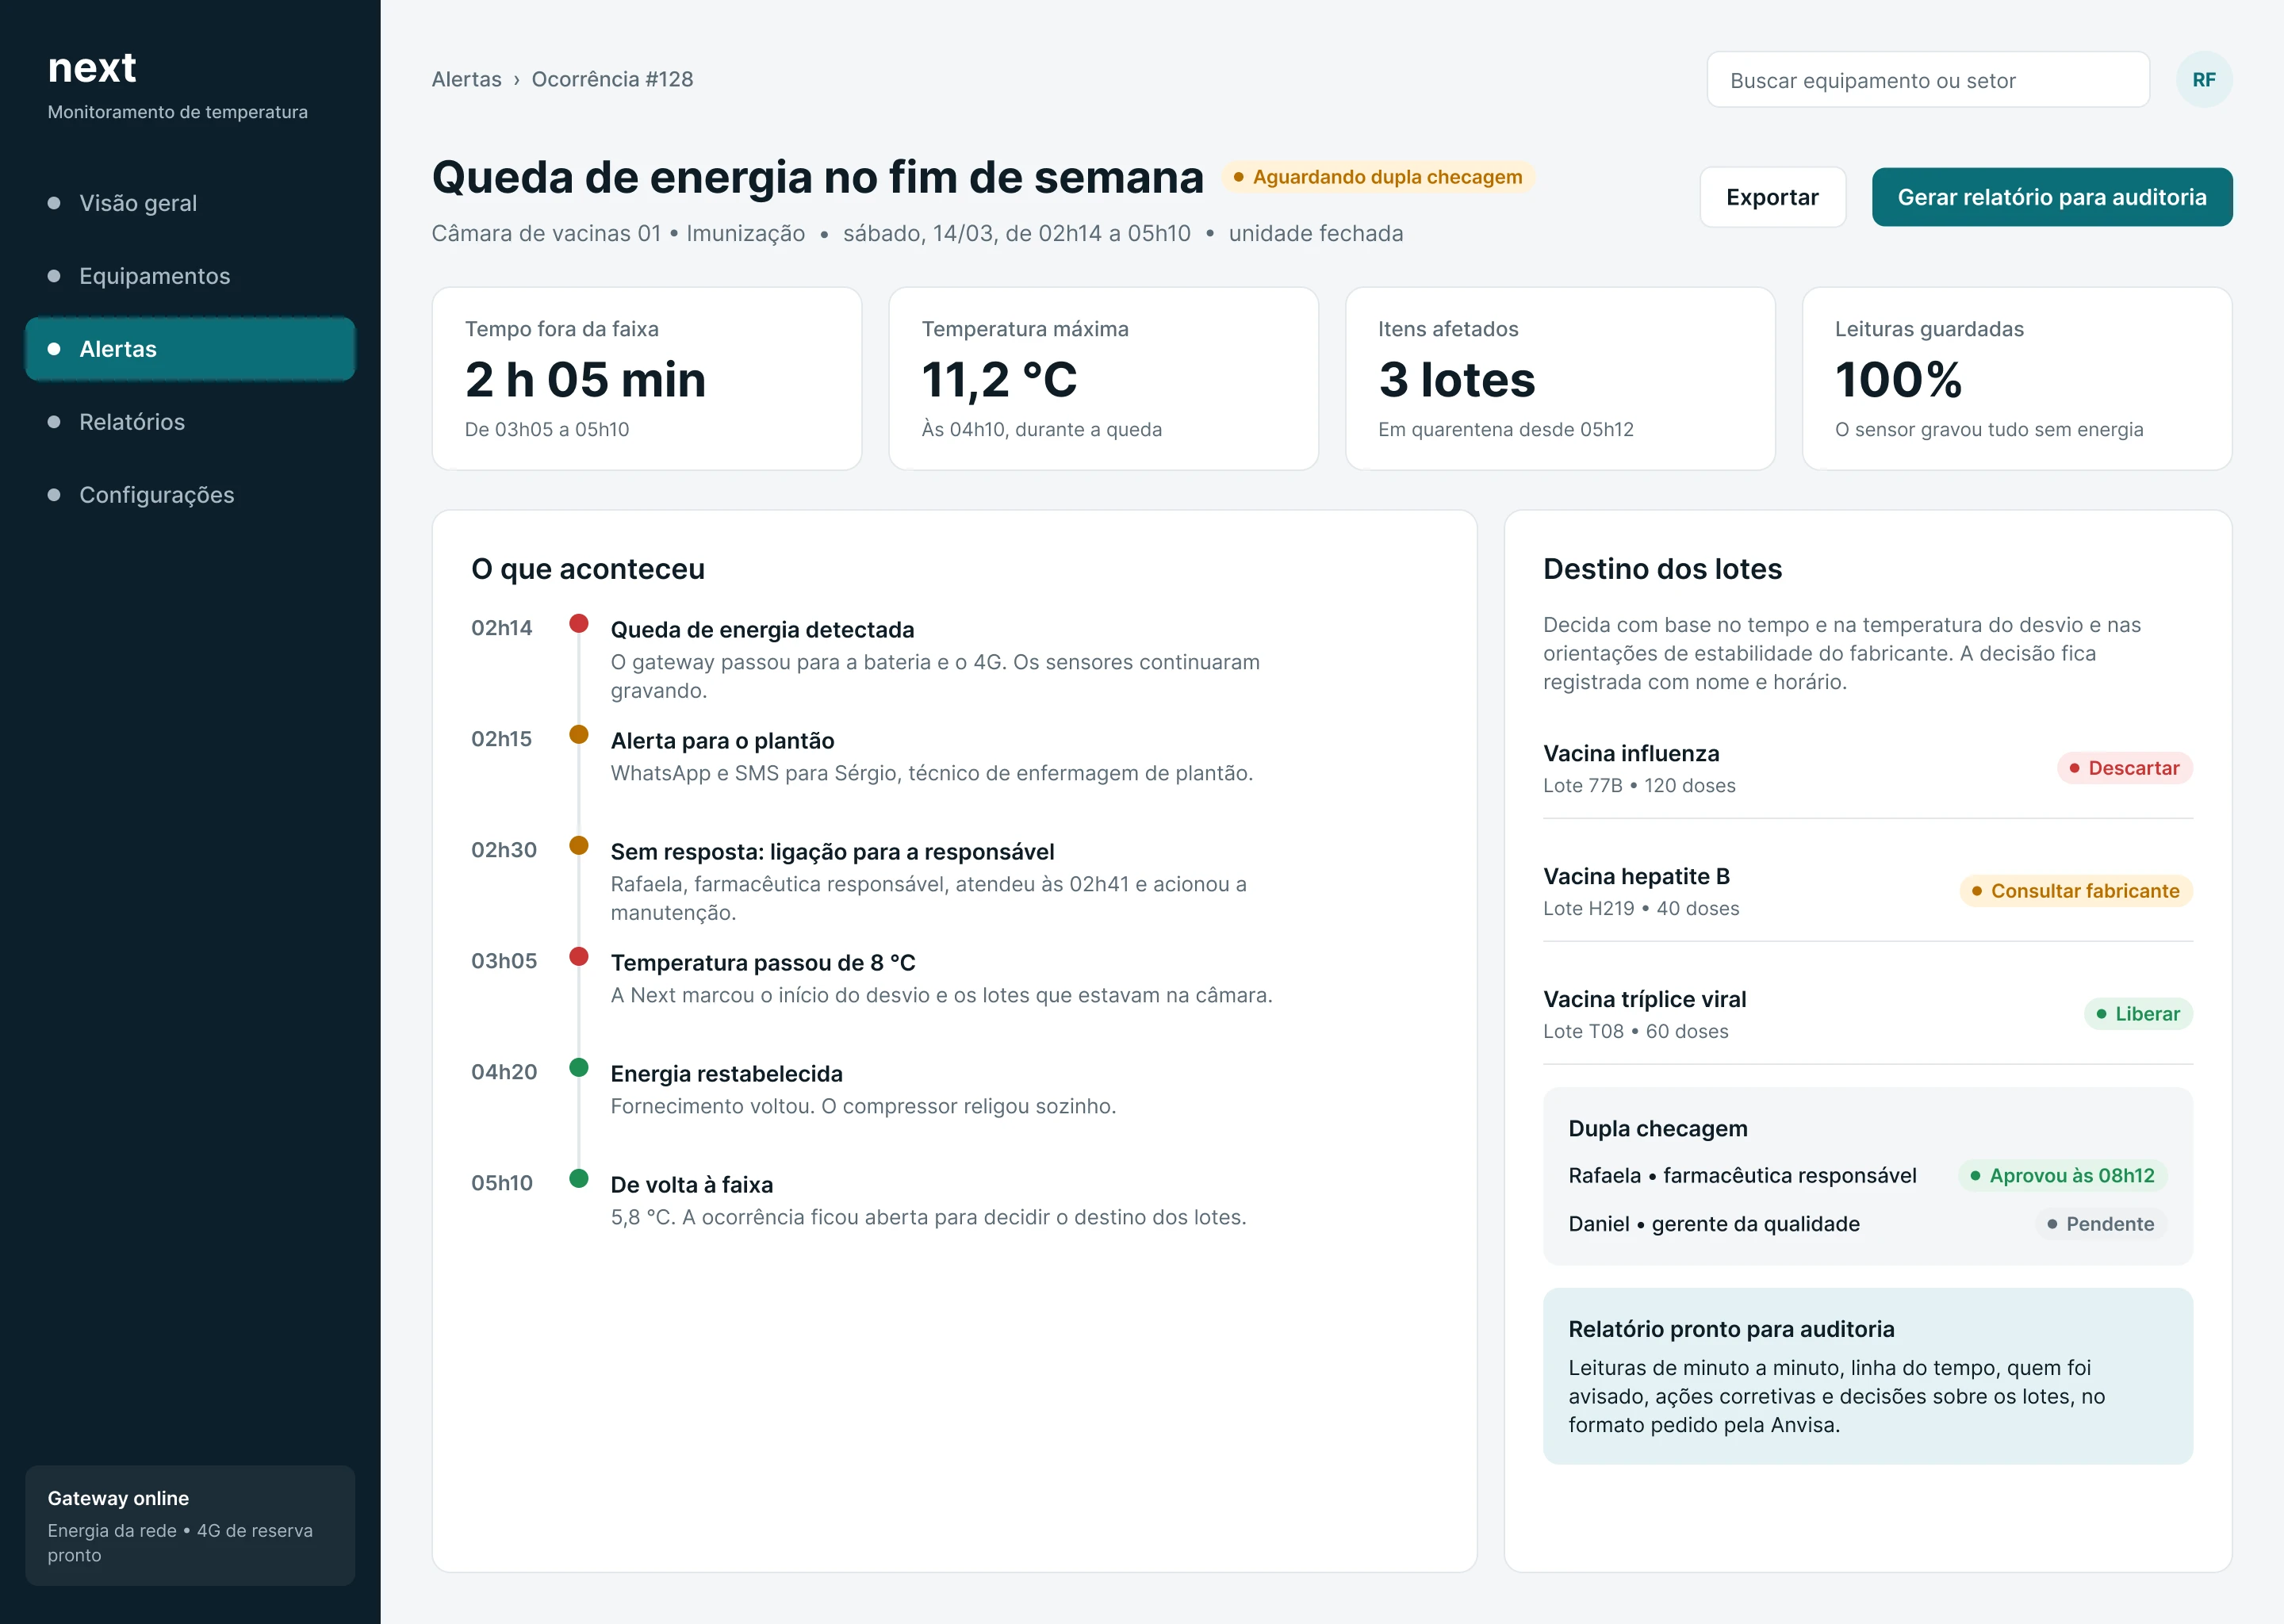
- Overnight timeline: power outage, alerts, escalation to the next level, temperature passing 8 °C, power coming back and the return to range.
- Batch outcome: discard, check with the manufacturer or release, with a double check.
- Audit report: generated in the format required by Anvisa.
Team
The case study had a multidisciplinary team of 12 people, including 2 designers: Enrico Gastaldelli and Alessandro Narimatsu de Faria.
Sources
- McKinsey: Ten trends shaping the IoT business landscape
- CargoSense: Cold chain shipping loss in pharmaceuticals
- Folha de Londrina: CFM reports poor conditions in health units
- G1 Amazonas: lack of supplies and poor conditions in public hospitals in Manaus
- Saúde Business: investment in technology and evidence-based medicine